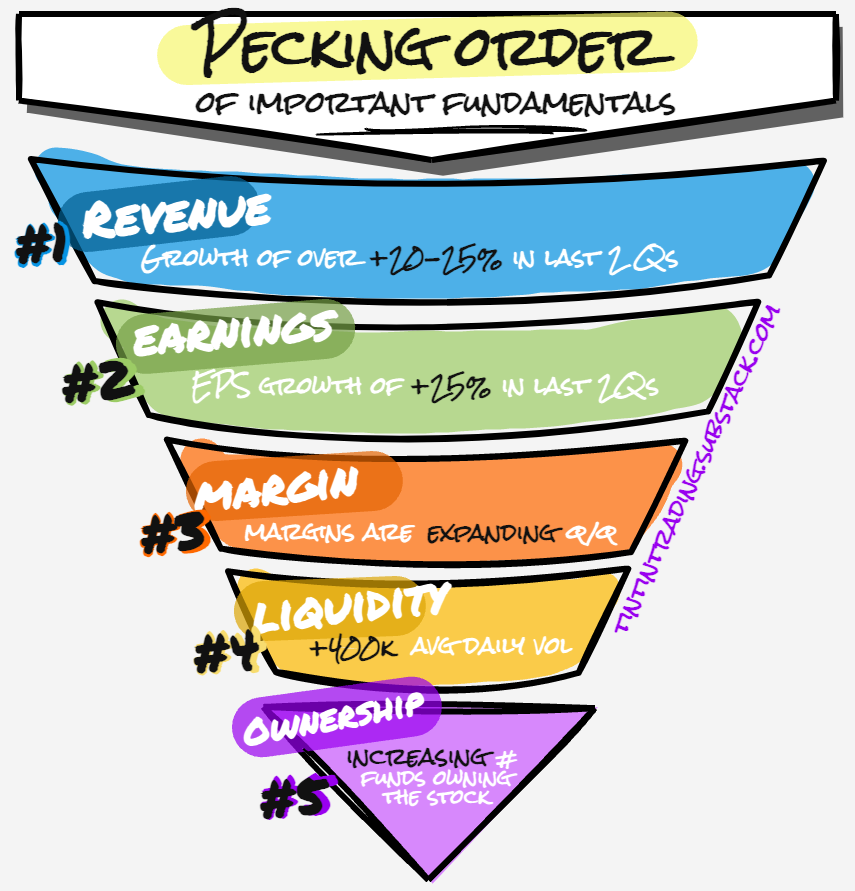
Fundamentals: by order of importance
5 metrics to watch out before entering a trade or investment and their thresholds.
About
The following article aims to share with you what do the fundamentals of my ‘ideal’ stock look like. As with everything in trading, these are only close guidelines not set hard rules. That being said let’s dive right into it. At the bottom of the article I have listed where I source information for these.
Key points
Revenue growth of +20-25% in the Last 2 Quarters
EPS growth of +25% in the Last 2 Quarters
Margin are expanding Quarter over Quarter
Liquidity is over 400k average daily volume
Ownership of funds is increasing Quarter over Quarter
Technical AND Fundamental Analysis
While technical trading is my go-to and it was the initial analysis method when I started to trade, most superperformance stocks are driven by improvement in fundamentals. What is interesting that this improvement is happening BEFORE the start of the massive stock gain. Henceforth, adding FUNDAMENTALS in your trading will give an extra edge and stack probabilities on your side. I put about 70% emphasis on the Technical criteria and 30% emphasis on the Fundamental criteria. This is to say that IF a stock has the fundamentals but NOT the technicals, I would not enter it, no matter the story or the headlines.
The pecking order of the analysis
REVENUE
Since 2008, Sales/Revenue have been much more important factor for driving institutional behaviour than prior to 2008. We look for stocks with at least +20% increase in Sales Growth by last 2 quarter. Growing demand for the company’s product is a first healthy sign for a potential of a big growth in the business.
EARNINGS
Earnings are also very important. We look for support between the sales and earnings numbers. In other words, in order to guard against inflated earnings, we would look for additional confirmation in the revenue numbers. To quote William O’Neil - by studying the 600 best performing stocks from 1952 to 2001, over 75% showed earnings increases of averaging more than 70% in the latest reported quarter BEFORE they began their major advance. The best comapneis show up to +100-500% growth in quarterly earnings growth (NB! This measures current quarter to the quarter 12 months ago, to take into consideration seasonality factors). Our criteria is Earnings Growth of +25% in the last 2 quarters.
MARGIN
If you have the revenues and the earnings getting the margin is the cherry on the top. Getting all three is the base for Mark Minervini’s Code 33 scanner (if you are looking for the exact criteria here, comment below or DM me on Twitter). What is important with Profit Margins is to see are they expanding or contracting? An expanding profit margin score, indicates higher efficiency in the business and better management. An mind blowing example that illustrates the connection between EPS and Margin is shown below. Henceforth, we look for expanding Profit Margins quarter over quarter.
LIQUIDIY
Stocks that trade less than 400,000 shares a day are considered “thinly" traded”. Institutions tend to avoid such stocks, since for them it is hard to establish a meaningful position. Fund economics are important (a large institutional fund cannot manage 1000s of stock and they cherry pick the best as per their methodology. However, since these funds are billions of dollars large even a 1% position means that they will be making over $100 mn position). Thinner stocks are move volatile and smaller positions can cause dramatic price shocks (up AND down). Our criteria is to enter in stocks of at least +400,000 shares average daily volume over the last 50 days.
OWNERSHIP
This is the I from CAN SLIM. Basically we look for Institutional sponsorship by mutual funds, banks, large institutions and other professional investors. The reason we look for institutions is that by the mere size of their buying, they are a powerful ally to have on your side, since they will support the stock in drawdowns and will push the price up by establishing positions. Bigger funds take weeks to months to establish their positions, which can make for a spectacular price move if you manage to catch it. The way to measure this is to look for increasing number of ownership quarter over quarter in the total number of funds. From then on, platforms like MarketSmith, allow you to look if ‘premium’ funds, e.g. Fidelity Contrafund, are holders of this stock and how have they managed their positions. Here is an example in the picture below:
Example
I use MarketSmith, as the go-to platform for checking all of these fundamentals and as a weekly screener tool. Here is how I review the fundamentals to meet the described criteria above.
If you do not have Marketsmith👇
Additionally, you could use the TradingView indicator that we have developed with my friend TED (check out his amazing newsletter here) the above mentioned criteria and a few more advanced rules 👉 link to indicator here 👈
Thank you!
💡These posts consume most of my Sundays! If you have received value:
Share it on Twitter (using the button below)
Subscribe to the newsletter.
This way you will help grow the community together!


