How to Identify Signs of Climax Runs in Stocks Like Tilray ($TLRY)?
A technical sell signal to protect your big winners
Table of Contents
1. Executive Summary
2. Introduction
3. Taser Example
4. Checklist for Climax Runs
5. Tilray Example
6. Conclusion
Executive Summary
Tilray ($TLRY) provided investors with a solid rally several years ago, prompting the question of when to sell stocks that go on such hot runs.
We have studied the best research-driven guidelines for spotting a climax run on stock charts which typically occurs after 18 weeks from breakout and features rapid price run-up over two or three weeks with 25%-50% gain during this period.
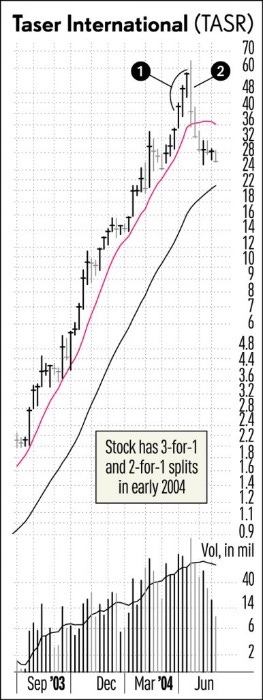
Taser International's ($TASR) example shows how to spot signs of climax runs including wide trading range, excessive stock splits and being extended more than 100% above 200-day line and briefly eclipsed all time highs before plunging 62% from $35.95 to $13.56.
Introduction:
After the summer of 2018, Tilray ($TLRY), a Canadian cannabis company, went on an incredible run, rising more than 400% in just two months before dropping 70% in 3 days and losing most of its gain in the next 12 months. It was a classic example of what’s known as a climax run — a stock that rises too quickly and then falls sharply — but for many it’s unclear when exactly investors should sell stocks that go on such hot runs. Fortunately, there are research-driven guidelines for traders, which can be used to spot signs of climax runs. Let’s take a look at how this works.
Definition: A climax is when the pace of the stock's increase suddenly picks up too much and then falls sharply
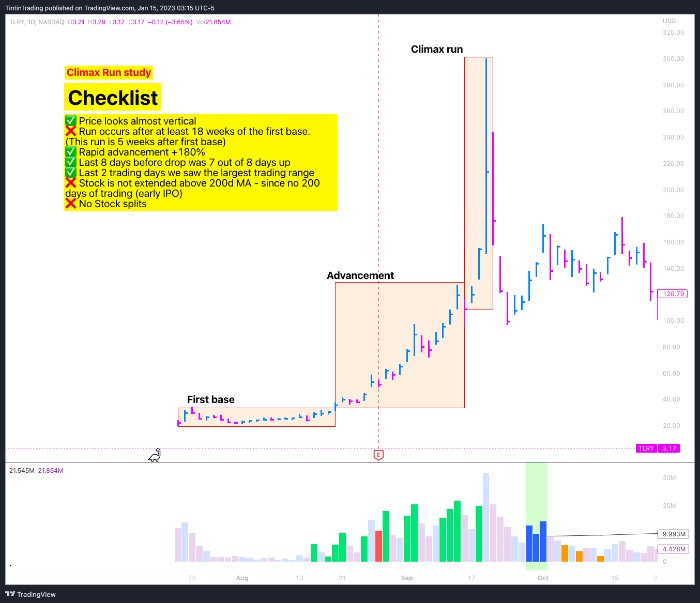
✅ Checklist for spotting Climax runs:
The price advance looks almost vertical on the chart
The run occurs at least 18 weeks after a breakout from first or second stage base
The chart has 2 or 3 weeks of rapid advancements (between 25-50% during that period)
The stock has nearly no down days in the last 7-10 days (e.g. 7 out of 8 days up or 8 out of 10 days up)
There is wide trading range (high to low is very large compared to any prior week since the beginning of the move many months ago)
The stock is over 65% extended over its 200 day moving average
Stocks runs 25% to 50% for one or two weeks on a stock split
The topping day usually occurs on the heaviest daily volume without further price progress
Taser International's Example for Spotting Signs of Climax Run
One great example to study for for spotting signs of climax runs is Taser International Inc. ($TASR), which ran up 65% in the last 3 weeks. There were several signs that signaled the climax run was about to end, including a wide trading range and excessive stock splits. Additionally, it was extended more than 100% above its 200-day line — another sign that the rally had reached unsustainable heights. All these signals pointed towards the April 2004 peak offering the most timely signal for maximum gains before the stock started its descent and eventually plummeted 62%.
Important note Taser International ($TASR) is has changed its name to Axon Enterprises during 2017 and can be viewed under ticker $AXON.
Tilray Brands ($TLRY) Example using the above Checklist
Tilray ($TLRY) offered investors an incredible opportunity with its impressive stock rally, raising the question of when exactly the best time to cash out may be. It's important to remember that regardless of the current form of any stock, no company's success can last forever without a meaningful correction.
For most active traders, a good rule of thumb is to not sit on big gains for too long as doing so can set you up for a large loss if the market trend shifts downward. Conversely, if it appears a rise in value is going to be sustained over a longer period of time, you may want to make sure you do not jump off too early and miss out on additional potential profits. So, when deciding how long to keep your stocks, it's important to stay mindful and informed about both the company itself and wider movements in the market.
Using the above checklist we can see the IPO run up for Tilray gave some clear signals of a climax run.
More examples to study
Following examples are from William O’Neil’s “How to make money in stocks”
Conclusion & Takeaways:
Research-driven guidelines from market wizards like William O'Neil from Investor's Business Daily and Mark Minervini, can help traders identify signs of climax runs in stocks like TLRY 0.00%↑ — such as wide trading ranges, excessive stock splits and being extended more than 100% above 200-day line — which traders can use as indicators when deciding whether or not to sell their shares.
The examples discussed here also demonstrate that even if all fundamentals appear positive, there may not be enough time left to exit with maximum gains once a climax run begins its descent. As such, it is important for traders to pay close attention to stock charts, so they don't miss out on any potential opportunities or risks that arise throughout their investments journey.


