The $1 Stage Analysis Course
In this article we will review the main concepts of Stage Analysis and introduce TinTinTrading's Stage Analysis Course
Table of Contents
1. Stage Analysis Overview
2. Why is Stage Analysis Important
3. How to learn more about Stage Analysis?
4. What are the Four Stages of Stage Analysis System?
5. History on Stage Analysis?
6. Where can Stage Analysis be Applied?
7. Course Comparison for Stage Analysis
8. Stage Analysis Examples
Stage Analysis Overview
Stage Analysis is one of the first things that new traders needs to get familiar with. Stan Weinstein's Stage analysis, explains a way to quickly segment the market action into four stages that allow trader to determine wether there is high probability of making money or not. He noted his ideas in a book Secrets for Profiting in Bull and bear markets" (link).
Why is Stage Analysis important?
By studying the past, Mark Minervini and other Market Wizards, like William O'Neil, have used reversed factor modelling to create the "95% club". The reversal factor modelling is a historical study technique applied to the biggest winning stocks in the stock market from 1800s to current day. What they found is that 95% of the big winners shared common characteristics of how they looked technically and fundamentally. One of things that was common amongst allgreat stocks was that they were in Stan Weinstein's Stage 2 Uptrend.
This suggests that understanding and demanding Stage 2 Uptrend from the trade setups is a technique to find highly probable trades. This is exactly what we cover in our Stage Analysis Course.
How to learn more about Stage Analysis?
We have created a 4 hour video materials Stage Analysis Course that allows you to understand the ins and out of the Stage Analysis. In this course we will address the following questions important questions for the Stage Analysis System:
What are the different stages and how to determine what Stage a stock is in?
What are the exact concrete requirements that a stock exhibits as it develops between the stages?
How to determine if we are early or late in a given stage?
Where is the perfect buy point for traders according to Stan Weinstein and the Stage Analysis?
What sell techniques can you deploy to defend your profits and protect your account?
How to do a general market analysis like Stan Weinstein?
How to setup your daily routine so that you are not glued to the screens all day.
Apart from Video the course also gives the trader access to Special indicators on TradingView, Quizes so you can test your skill, Model Books to keep in your trading library and CheatSheets to help you while you trade.
You can find the Stage Analysis Course here. Promotional price for the first 100 people who purchase it.
Additionally, you can purchase Stan Weinstein's Stage analysis Book: Secrets for Profiting during Bull and Bear Markets (link).
What are the Four Stages in Stage Analysis System?
Stage 1: Consolidating Stage. Within this stage the stock is consolidating and preparing for a move. In essence we say that the stock is losing time.
Stage 2: Advancing Stage. This is the most rewarding stage to identify, since here the stock truly gains value. This is the stage Stan advices traders and investors to concentrate and trade breakouts from.
Stage 3: Topping Stage. This is Stage is the place where volatility increases and the stock creates violent moves within a price channel.
Stage 4: Declining Stage. This Stage is the best stage to short a stock as it is a begining of a big decline. It is the point where the stock has confirmed its breakdown and decline.
There are advanced techniques for traders who really want to understand the Stage Analysis System by learning to determine Early Stages and Late Stages. An early Stage 2 would hold the name Stage 2A. All of this and how to determine which Stage a stock is in, we cover in our Stage Analysis Course, which can be found here.
History on Stage Analysis
Stage Analysis is a strategy to develop long term trends trading. In his 1988 book Secrets for Profiting in Bulls and Bear Markets, Stan Weinstein explains this in detail. Stage analysis uses chart patterns to describe the four distinct stages in trades. The stages are specific guidelines for buying, selling or maintaining a stock if they are deemed appropriate. It provides a simple way of trading. Stage Analysis assists investors and traders to identify trending markets over time and stay invested. Since then, the method has been used and popularised by Mark Minervini, who does a high level overview of the methodology in his books. Mark calls Stage 2 a 'non-negotiable' criteria on his method for stock picking. Stan Weinstein and Mark Minervini a great friends and frequently interact with one another regarding their feel for the market. Stan Weinstein has publicly shared that since he purchased the Secrets for Profiting in bull and bear Markets book, the trading world has turned into a "Bellagio" - referring to changes in the market structure. This is why, using courses to understand how his technical analysis system is relevant today is important.
Where can Stage Analysis be applied
Stage Analysis is a method for technical analysis that is applicable to both traders and investors. Stan Weinstein has been applying the method for over 40 years and has consulted many hedge funds and institutional clients based on the methodology. He mostly trades equities and indexes using a breakout swing trading approach. However, Stage Analysis is applicable for any asset class. This can be for FOREX, Crypto, Bonds or any other asset. This is because the method is based on technical analysis.
Stage Analysis Course Comparison
We are aware that there are various other content creators who provide courses focused on the Stage Analysis methodology, and this is just another validation for the genius Stan Weinstein and the secrets for profiting he has discovered in his decades trading the markets.
We have done a high level comparison on the content of the top 3 courses on Stage Analysis and are confident that the TinTinTrading Course provides amazing value for money.
Stage Analysis Examples
In the following section we will look at 4 examples of the Stage Analysis methodology that show the four stages of the technical analysis methodology. I have annotated the examples in the section. The blue yellow line indicator above the charts is our own custom Stage Analysis Indicator (link). This indicators can be purchased at preferential rate if you buy the Stage Analysis Course.
Example of a stock in Stage 1
Stage 1 is when the chart is consolidating. This is the first stage when an investor should start considering a stock and put it on his watchlist.
Example of a stock in Stage 2
Stage 2 is the stage where Stan Weinstein has recommended to be the first place where traders and investors start to position themselves during breakouts. This is where traders are profiting in bull in long positions.
Example of a stock in Stage 3
Generally, at the first signs of a Stage 3, the trader should be decreasing his positions. This is volatile period where stop losses are likely to get hit.
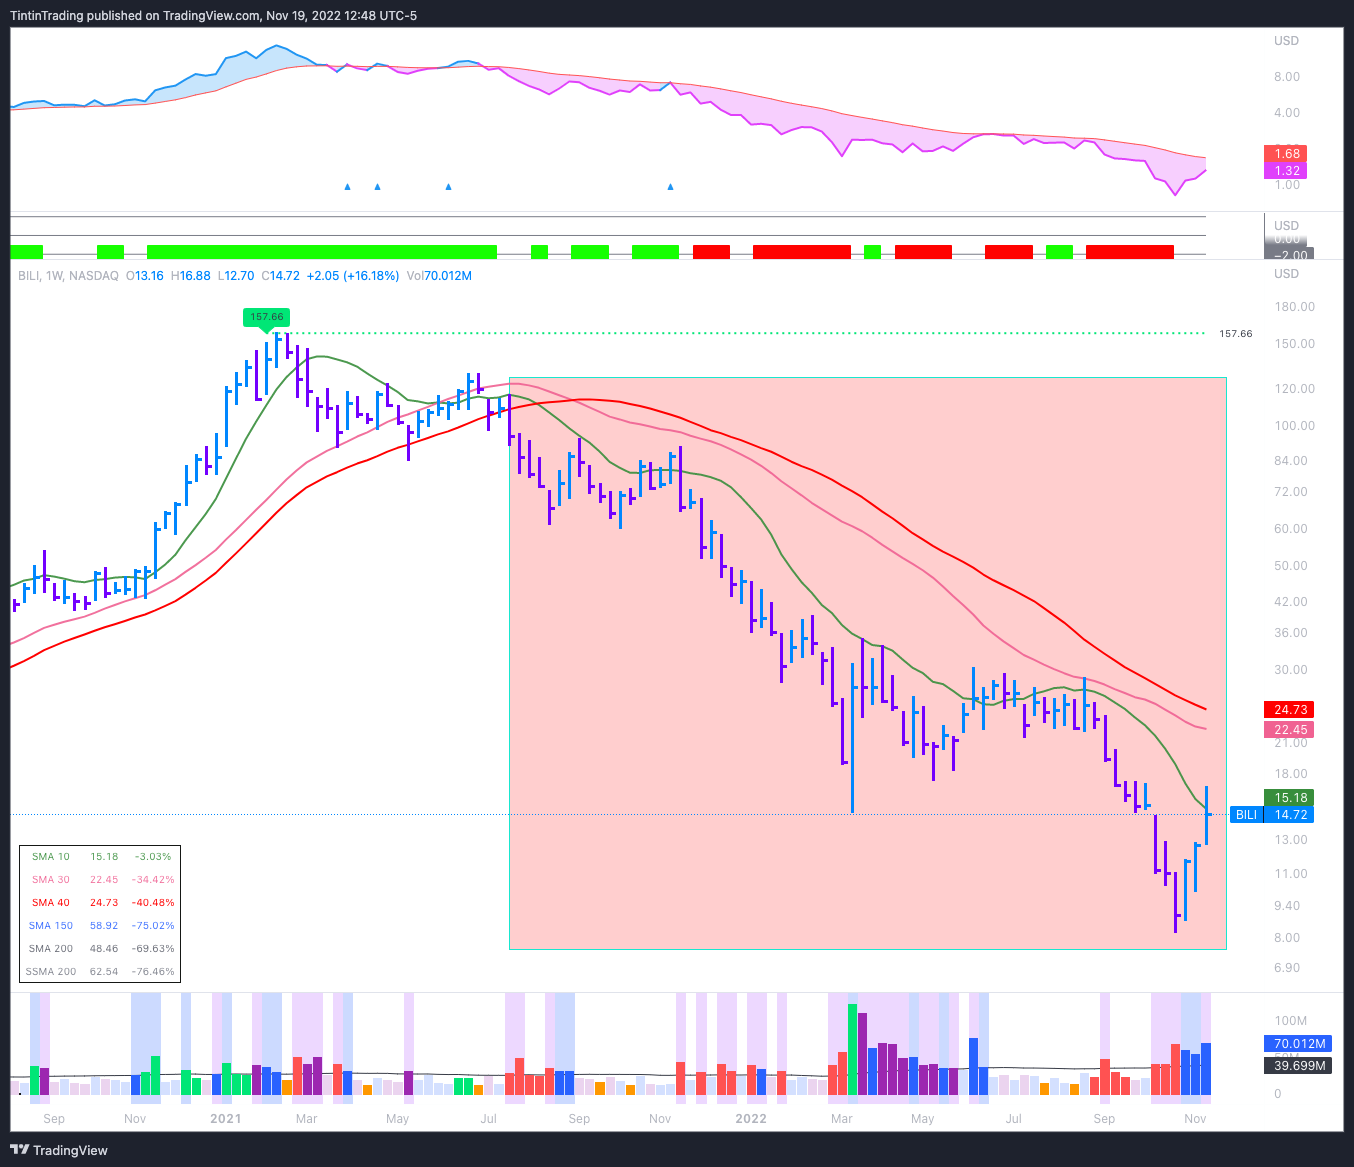
Example of a stock in Stage 4
Stage 4 is a great place to start shorting stock, since it is starting to breakdown. Generally, all Stage 4 moves are associated with breakdown but there is a small caveat of a Stage 4B- (covered in the course) which is an advance technique for a bullish play.
Using concrete, objective rules you will be able to identify the different stages of Stage Analysis. For convenience our course also includes a CheatSheet and CheckList to apply practically the lessons learned in this trading.
Thank you!
💡These posts consume most of my Sundays! If you have received value:
Share it on Twitter (using the button below)
Subscribe to the newsletter.
This way You will help grow the community together!


Hi TinTin
I just signed up for the course, and I start to watch some videos. It's a great course - I enjoy it so far.
My Tradingview ID is chartAddict. Would you please grant me access to the four free indicators? Thanks in advance!
Henry
hi,
tradingview id: - primitivetrader
I have purchased your stage analysis course. kindly give access to the indicators in tradingview.
thanks