
Turning Dreams into Data: Master Your Trading with the FREE Trading Goal Calculator
Do you know how many trades you need to achieve your goal? If not...keep on reading.

TLDR
· Tools can quantify your plan: The Trading Goal Calculator lets you enter capital, risk per trade, win rate and average gains/losses to calculate position size, expected return, trades needed, risk–reward, Kelly criterion and time to reach your profit goal. It offers both simple (no compounding) and compound models.
· Breakout trades require planning: A breakout happens when price moves above resistance or below support on rising volume and can lead to major trends. Effective breakout trading requires defining support/resistance, waiting for confirmation, and cutting losses quickly[1].
· Risk‑reward and win rate matter: A simple risk–reward table shows you need only a 33 % win rate to break even at a 2:1 reward‑to‑risk ratio, 25 % at 3:1 and 20 % at 4:1[2]. But as traders we are not here to breakeven - as with most things we have goals that we want to achieve - if it is 20%, 50%, 100% or 300% returns.
· How active to be as trader: Do you know how active you have to be to achieve your goal? Is it realistic to achieve it this year, given the stats you put? This article answers exactly this question and gives you a free tool to play around with.
Video Summary 👇
Introduction – The dream and the data
If you’ve ever watched a breakout play out in real time, you know the adrenaline rush. A stock knocks against resistance, hesitates, then surges as if freed from a cage. The profits from a well‑timed breakout can feel like magic—but most traders also know the heartbreak of a “fake‑out” that reverses and drains their account.
Trading isn’t a game of guessing; it’s a game of probabilities. Breakouts, risk–reward ratios and position sizing are all numbers. Instead of dreaming about 10‑baggers, it’s smarter to calculate whether your trading statistics actually support your goals. That’s where the Trading Goal Calculator comes in. Let’s unpack breakout methodology, face the harsh statistics, and see how this free tool can turn your dreams into data‑driven reality.
Beyond Risk–Reward Ratio
Breakout trading is not about winning every trade—it’s about ensuring that your winners are larger than your losers. Reward‑to‑risk (R‑R) ratio measures how much you expect to gain relative to what you are willing to lose. Tradeciety’s guide shows that with a 3:1 R‑R ratio you can lose three out of four trades and still break even[9]. The breakeven win rates for common R‑R ratios are:
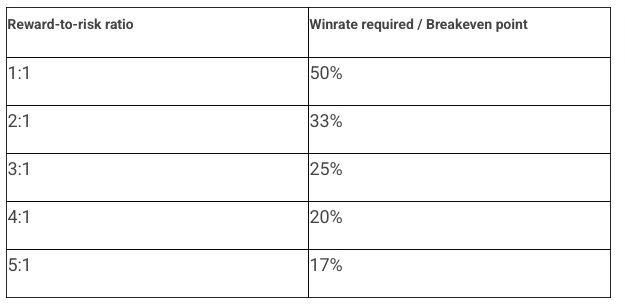
These numbers reveal a powerful truth: with a high R‑R ratio you don’t need to be right most of the time. Many breakout traders aim for 2:1 or 3:1 and accept that they will be wrong frequently, knowing that a few big winners will offset many small losses.
However, Risk-Reward Ratio is not enough for you to understand if you need to modify your style to achieve your goal. It only answers the question: What win-rate do I need to achieve to be profitable.
Introducing the Trading Goal Calculator
Most traders know their goals (“double my account!”) but few can answer the essential questions: How many trades will it take? What position size should I use? Is my win rate and risk‑reward combination sufficient? The Trading Goal Calculator at trading‑goal‑calc.lovable.app bridges that gap. It’s a free, interactive tool designed to help you understand whether your statistics can realistically achieve your trading goals.
What it does
The calculator asks for eight key inputs:
1. Starting capital: the amount of money you’re trading with.
2. Risk per trade (%): the percentage of your capital you’re willing to risk on each trade.
3. Profit goal (%): the percentage gain you’re aiming for overall.
4. Average gain when you win (%).
5. Average loss when you lose (%).
6. Win rate (%): how often you expect to win.
7. Leverage: optional; set to 1 if you don’t use leverage.
8. Concurrent trades: how many positions you can handle at once.

From these inputs the tool instantly computes:
· Position size: the dollar amount per trade.
· Expected return per trade.
· Risk–reward ratio.
· Kelly criterion (optimal fraction).
· Number of winning and losing trades needed.
· Total trades required (simple vs. compound models).
· Time to reach your goal (in days, months and years).
Simple vs. compound models
The calculator offers two projections:
· Simple Model (fixed returns, no compounding): calculates how many trades it will take to reach your goal if your capital stays the same.
· Compound Model (with compounding): shows how reinvesting profits can reduce the number of trades and time required.
Practical examples
Example 1 – Ambitious risk with high reward
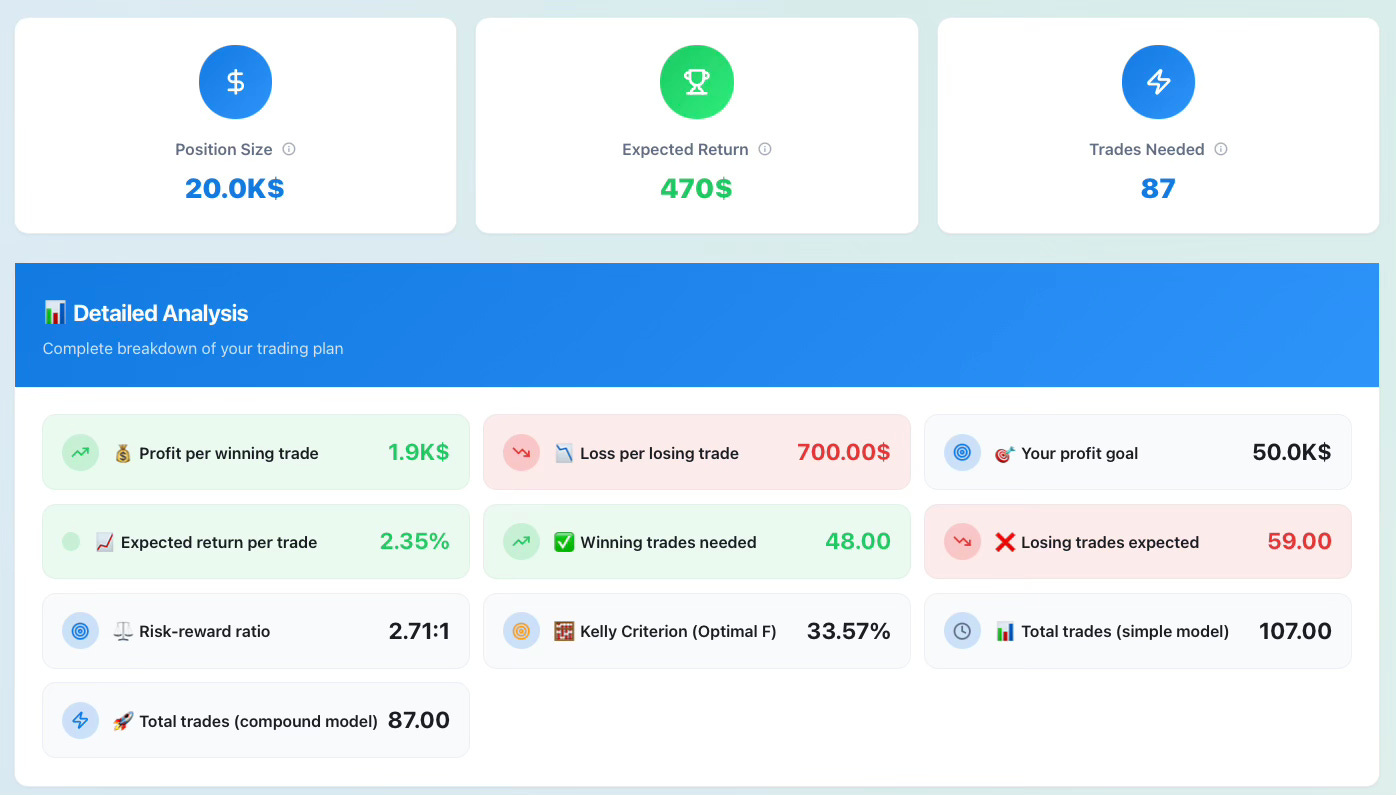
Suppose you have $100 k and plan to risk 20 % per trade (very aggressive), aiming for a 50 % overall gain. You believe your average win is 9.5 %, average loss is –3.5 %, and your win rate is 45 %. The calculator tells you:
· Position size: $20 k
· Expected return per trade: 2.35 %
· Risk–reward ratio: 2.71:1
· Kelly criterion: 67.14 %
· Winning trades needed: 48; losing trades expected: 59
· Total trades (simple model): 107; total trades (compound model): 87
· Time to reach goal: 107 days (simple) vs. 87 days (compound) – roughly 3.6 months vs. 2.9 months
This scenario highlights the power of a strong risk‑reward ratio and moderate win rate. Although you lose more trades than you win, your large position size and higher average gain offset the losses. However, risking 20 % per trade can quickly lead to large drawdowns—something only the most experienced traders might attempt.
Example 2 – Conservative approach
Now imagine you trade $50 k and risk 2 % per trade. You aim for a 10 % overall gain, expect to gain 4 % when you win and lose 2 % when wrong, and you win 50 % of your trades. According to the calculator:
· Position size: $1 k per trade
· Expected return per trade: 1.0 %
· Risk–reward ratio: 2:1 (reward is double the risk)
· Kelly criterion: 50 %
· Winning trades needed: 250; losing trades expected: 250
· Total trades required: 500 trades (simple model) or 477 trades (compound model)
· Time to reach goal: roughly 16.7 months vs. 15.9 months – compounding shaves about 23 days off
This conservative example shows how long it can take to reach a 10 % target when you risk small amounts per trade. Even with a respectable win rate and a solid 2:1 R‑R ratio, you need hundreds of trades to hit your goal. It illustrates why many traders either increase their risk per trade or accept a longer timeline.
Sensitivity analysis – find your levers
Ever wonder which input matters most? The Sensitivity Analysis tab analyses how changes in your win rate, average gain, average loss, position size and profit goal affect the number of trades needed. Each factor is colour‑coded by impact (low, medium or high). In our Example 1 scenario, the analysis revealed that average loss and win rate have the biggest leverage, with potential to swing the trades needed by +140 % and +123 % respectivelypreview--trading-goal-calc.lovable.app. By contrast, increasing position size or your overall profit target has far less effect (around +11 % and +3 %).
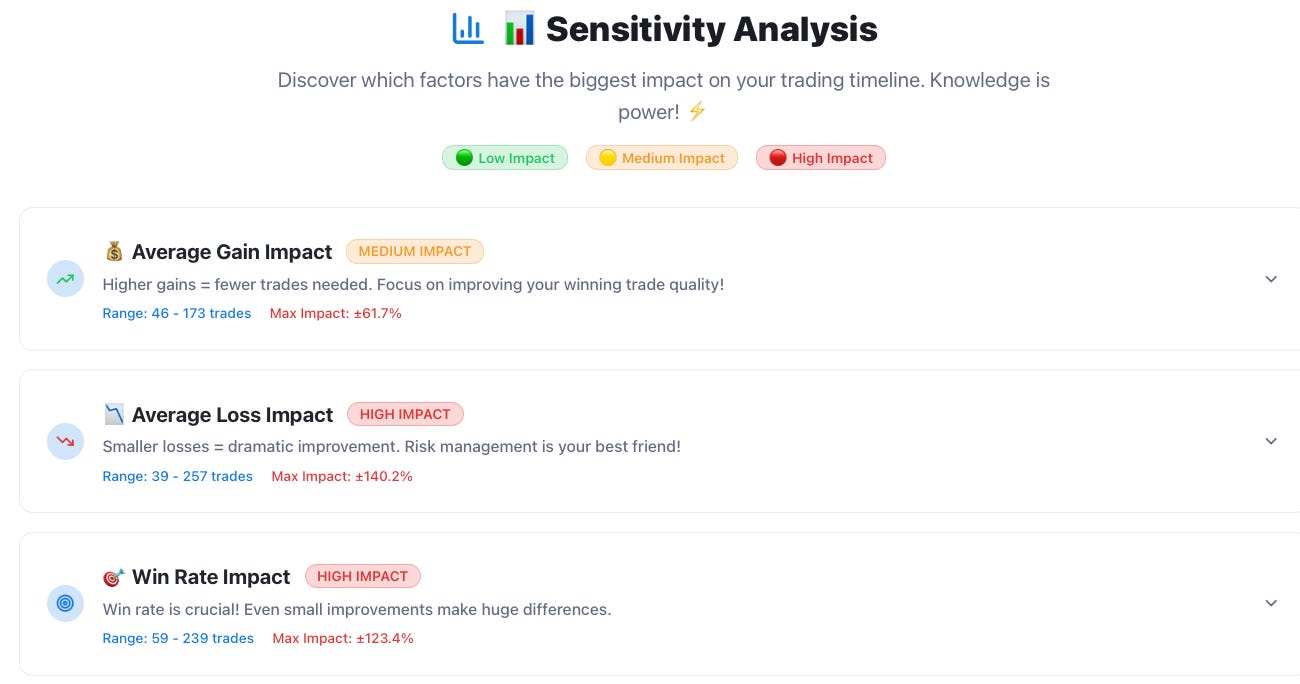
The key insight: focus your energy on improving trade quality and risk management—smaller losses and a higher win rate accelerate your journey far more than chasing bigger goals. A handy Key Insights box summarises the most impactful factors and suggests quick wins like cutting losses faster and refining your setupspreview--trading-goal-calc.lovable.app.
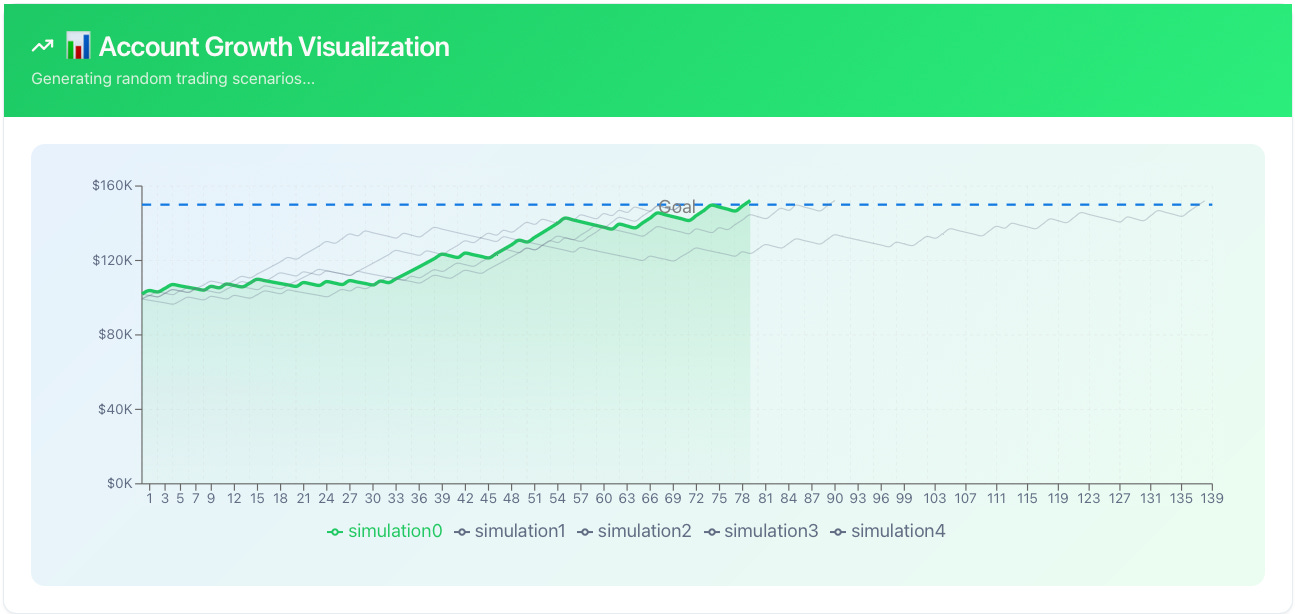
Monte Carlo growth simulator – embrace randomness
Markets are messy. Even with identical statistics, your returns will vary due to the sequence of wins and losses. The Monte Carlo Growth Simulator lets you see that variability by running multiple random simulations. You choose how many simulations to run (1 to 5) and the tool generates different trade sequences. For our high‑risk Example 1 inputs, three simulations produced final balances between about $151 k and $152 k, with total trades ranging from 70 to 113 and actual win rates between 41 % and 50 %preview--trading-goal-calc.lovable.app. A live chart shows each equity curve relative to your goal, and you can click a simulation card to inspect a trade‑by‑trade breakdown. This table lists the start balance, position size, result (win or loss), profit or loss amount, and ending balance for each trade, along with summary statistics like actual win rate and total profitpreview--trading-goal-calc.lovable.app. By visualising the distribution of outcomes, you learn to expect drawdowns and variance even when the long‑term expectancy is positive.
Timeline optimizer – accelerate your journey
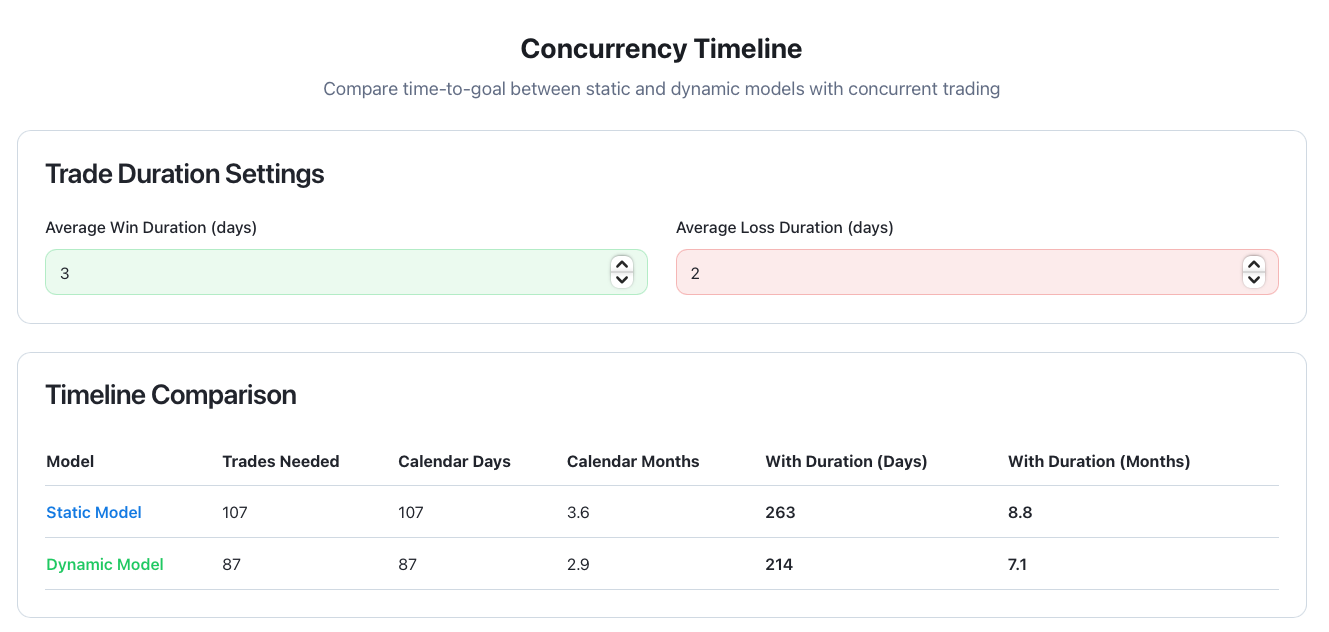
The Timeline Optimizer bridges the gap between theory and reality by factoring in the duration of trades and the number of positions you can hold concurrently. Under a static model, you take one trade at a time; under a dynamic model, you reinvest profits and can open new trades before the previous ones close. In our Example 1 inputs, assuming winning trades last 3 days and losing trades last 2 days, the static model would take 263 days (8.8 months) to hit the profit goal, whereas the dynamic model cuts that to 214 days (7.1 months) by allowing overlappreview--trading-goal-calc.lovable.app. A comparison table shows the trades needed, calendar days and months under both models, while a bar chart visualises the differencepreview--trading-goal-calc.lovable.app. At the bottom, the tool estimates the fastest timeline and the concurrency benefit—how much time you save by holding multiple positionspreview--trading-goal-calc.lovable.app. This feature helps you decide whether increasing the number of concurrent trades (within your risk tolerance) can meaningfully shorten your path to your goal.
Key takeaways and action plan
1. Define your edge: Breakout trading requires more than spotting patterns. Define your entry, stop and target before the trade. Wait for confirmation and follow volume.
2. Focus on risk–reward: Aim for at least a 2:1 reward‑to‑risk ratio so you can be wrong more often than right and still be profitable[2].
3. Embrace small losses: Cut losing trades quickly. Large losses devastate your capital and make it nearly impossible to recover.
4. Use the Trading Goal Calculator: Input your realistic statistics and see if your goals are achievable. Adjust your risk per trade, win rate or target until the numbers make sense. Don’t set yourself up for disappointment by expecting exponential growth with a tiny risk and low win rate.
5. Invest in learning and discipline: Remember that most traders lose money[3]. To be in the minority that succeed, you must continuously learn, practice and control your emotions.
6. Start small and scale: Test your strategy with small position sizes or paper trading, then gradually scale up when you prove consistency. Compounding only works when you have an edge.
Conclusion – From dreams to data
Breakout trading is exhilarating, but sustainable success lies in numbers and discipline. Without risk‑reward planning and position sizing, even the best breakout setups can become landmines. Tools like the Trading Goal Calculator empower you to turn vague ambitions into quantifiable goals. By understanding your statistics, embracing a solid risk–reward ratio and learning from masters like Minervini and Zanger, you can navigate the markets with clarity rather than hope. Dream big—but do the math.