Unlocking the Secrets of the Zanger Volume Ratio: A Comprehensive Guide
How to use the Zanger Volume Ratio for TradingView
Introduction
The Zanger Volume Ratio (ZVR) is a remarkable tool for traders seeking to harness the power of volume analysis in their trading strategy. Originating from the insights of Dan Zanger, a record-setting trader known for his ability to transform a modest investment into millions, the ZVR is more than just an indicator; it's a comprehensive approach to understanding market dynamics. In this article, we'll dive deep into the ZVR, exploring its foundation, how it works, and how traders can apply it to identify promising trading opportunities.

Understanding the Zanger Volume Ratio (ZVR)
What is the Zanger Volume Ratio?
The ZVR is an innovative tool designed to analyze trading volume in relation to past performance, providing traders with insights into potential breakouts or pullbacks. All Market Wizards, from Livermore to William O’Neill agreed that volume is extremely important when it comes to trading the breakout methodology. Generally, it is agreed that +40-50% above the average volume for the day is required during the breakout to really stack probabilities on you hand. However, how do you know what the volume would be at the end of the day, when the stock is breaking out in the morning? This is exactly the problem that the Zanger Volume Ratio is addressing.
The [TTI] Zanger Volume Ratio ZVR is helping traders forecast the end of day volume as the stock is breaking out, so that they can stack probabilities on their side
Th [TTI] Zanger Volume Ratio ZVR indicator, measures the volume of a security against its 20-day average, looking for unusual volume patterns to signal better trading opportunities.
The Science Behind the ZVR
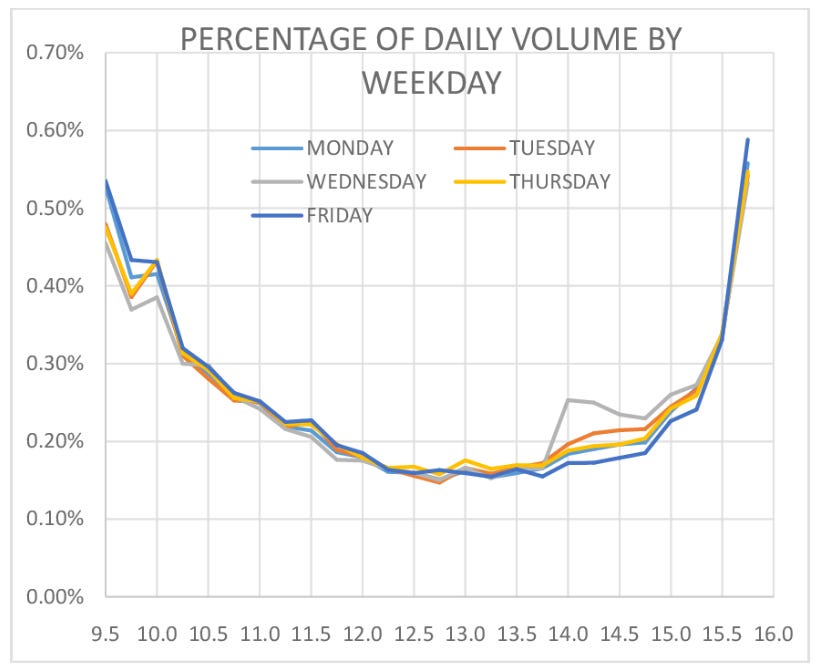
Dan Zanger emphasises the importance of volume as a confirmation of trades. The problem with using averages when comparing intraday volumes is that the intraday volume is not evenly distributed throughout the day. This means that the First hour and the Last hour hold significantly higher percent trading activity than the rest. This results in something like the chart below:

The ZVR categories volume into different levels, taking the above reality in perspective - Extreme, High, Average, Light, and Dry up - each providing unique insights into market sentiment and potential price movement. High or Extreme volumes at critical trading points suggest strong conviction among traders, often preceding significant price breakouts or continuations of trends. The indicator uses the relevant volume for the intraday period and calculates whether the current volume pattern that the stock is showing is very high than the average for this hour. An Extreme reading of 2.5 reads like this
”If the stock continues with its current pattern it will end 250% higher than the average for the day”
How to Use the Zanger Volume Ratio
Identifying Breakout Opportunities
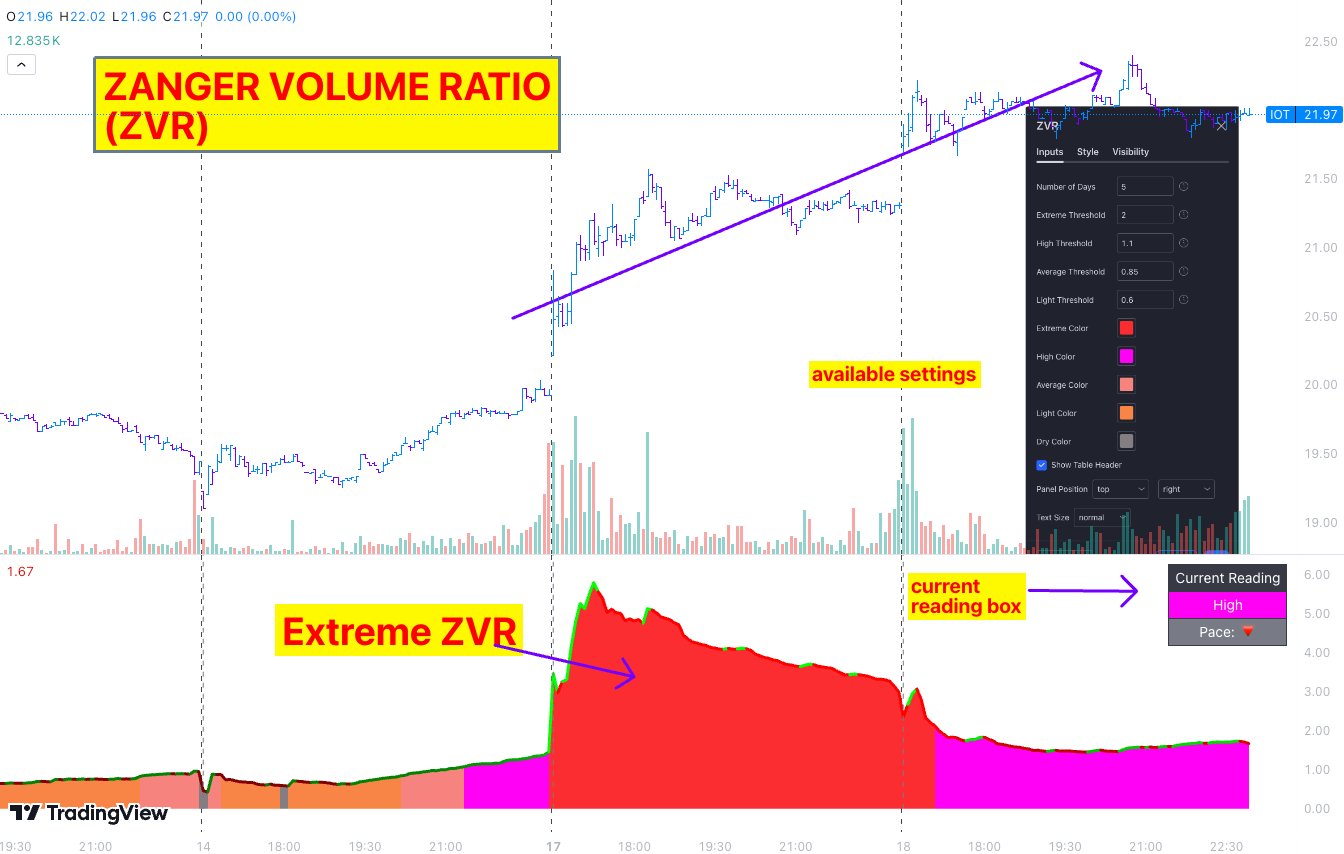
The essence of the ZVR lies in its ability to highlight stocks breaking out of consolidation zones on high volume. This is crucial for traders looking for securities poised for significant moves. The ZVR suggests that a stock breaking out of a multi-month base on High or Extreme volume has the conviction to sustain its move, avoiding fallbacks into previous ranges. As you an see below, the red color of the breakout day on IOT during 17APR2023, was the first signal to a 2 day +10% move/
Analyzing Volume Patterns
The tool not only tracks the volume but also its pace, showing whether buying or selling intensity is increasing or decreasing. A rising volume pace alongside a price breakout indicates strong increasing momentum, while a decreasing pace may signal a weakening move, guiding traders on when to enter or exit positions.
The indicator shows pace using 2 methods. The green/red line covering the low:
Green shows increasing intensity, while red shows decreasing intensity of volume serge
Box showing the latest reading. Pace with red arrow pointing down shows decreasing pace and Pace with white arrow pointing up shows an increasing pace.
Workflow: How I use the ZVR indicator
For me the [TTI] Zanger Volume ratio is a NON-Negotiable requirement for a breakout. Here are my general steps:
I create my weekly watchlist of stocks that have proper constructive bases (read my free Anatomy Series here) on Sunday.
I then add alerts on the pivot breakouts. I use Minervini style of trading and use his famous tactical buys like: Low cheats, Cheats, Pullback buys and proper breakouts
When a breakout triggers my alert, I instantly look at the [TTI] Zanger Volume Ratio on my TradingView chart and look for either Extreme Volume or High Volume
If the Volume is Light or Dry - I either skip the trade or position size smaller. I have found that these breakouts are more likely to squat and reverse to breakout point therefore are lower probability setups
If the Volume is Average, I position size normally
If Volume is Extreme or High AND if I ma getting traction in my recent trading, I am more likely to open larger position and trim some off intraday to finance risk.
Application of the ZVR
To effectively utilize the ZVR, traders should integrate it into their daily analysis, focusing on stocks that show significant volume deviations. By identifying these patterns, traders can better time their entries and exits, maximizing potential gains while minimizing risks. The ZVR works best when combined with other technical indicators, providing a robust framework for making informed trading decisions.
EXAMPLE of Breakout on EXTREME ZVR
As you see below, when the TradingView [TTI] Zanger Volume Ratio breaks out with extreme volume on COIN on 27 Feb 2024, this triggered a 37% gain in 9 days.
EXAMPLE of Breakout on DRY ZVR
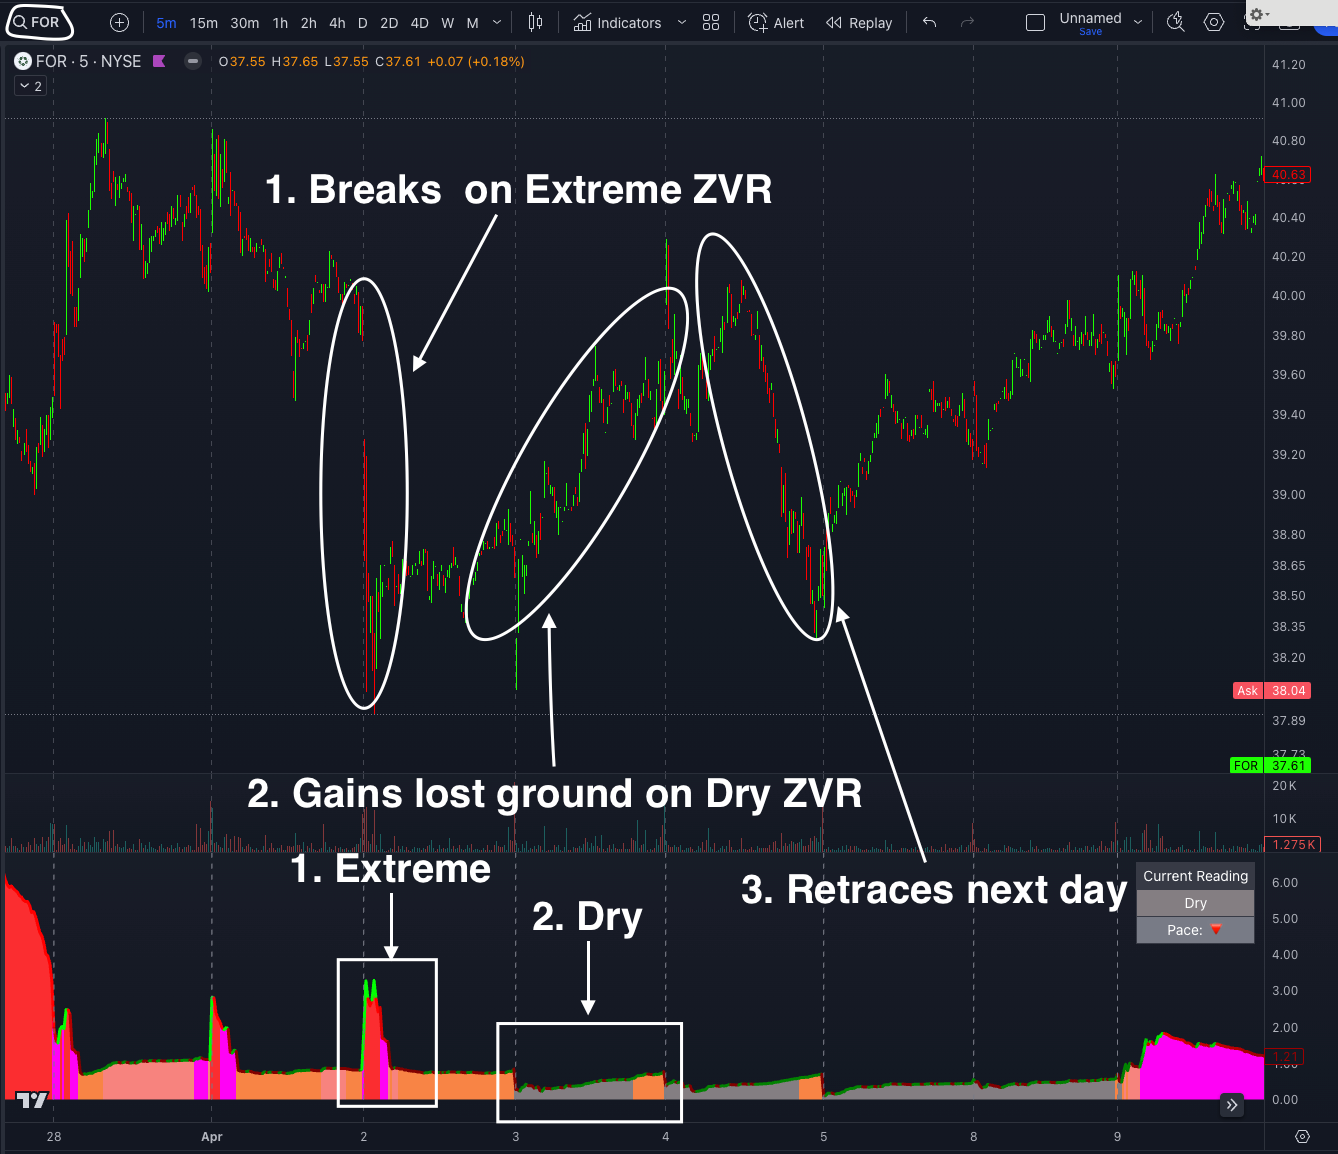
However, when the breakout/regain happens on Dry volume as the example below on FOR, then the stock retraces the next day immediately. It moves back up on dry volume and then breaks down. Additional sign was that prior to the regain the stock broke down (gap down) on Extreme volume. This shows that the gap down was carried with significant volume behind.
Conclusion
The Zanger Volume Ratio offers traders a powerful tool for leveraging volume analysis in identifying high-potential trading opportunities. By understanding the nuances of how volume interacts with price movements, traders can gain insights into market dynamics, improving their trading strategy's effectiveness. Whether you're a seasoned trader or just starting, incorporating the ZVR into your toolkit can enhance your ability to spot and capitalize on market trends.
For those interested in delving deeper into the ZVR and the strategies of Dan Zanger, resources like TradingViewIndicators.net and the ZVR for TradingView provide valuable information and tools tailored for both beginners and experienced traders. As always, successful trading involves a mix of insightful analysis, disciplined strategy, and continuous learning.


![[TTI] Zanger Volume Ratio indicator showing increasing pace [TTI] Zanger Volume Ratio indicator showing increasing pace](https://substackcdn.com/image/fetch/$s_!XZow!,w_1456,c_limit,f_auto,q_auto:good,fl_progressive:steep/https%3A%2F%2Fsubstack-post-media.s3.amazonaws.com%2Fpublic%2Fimages%2F80ceb4ca-be12-426e-8f02-4ec60b36fabe_453x413.png)

![[TTI] Zanger Volume Ratio on TradingView [TTI] Zanger Volume Ratio on TradingView](https://substackcdn.com/image/fetch/$s_!hvO6!,w_1456,c_limit,f_auto,q_auto:good,fl_progressive:steep/https%3A%2F%2Fsubstack-post-media.s3.amazonaws.com%2Fpublic%2Fimages%2F4ded3de0-ac41-4692-a9fc-f0799f41e099_1324x1100.png)
