SUMMARY
🟡 Price action is encouraging but on low vol
🟢 Volume action shows signs of bottoming
🟢Sentiment is still bearish which is good
🟢 Macro Economy shows signs of peaking inflation
🟡 We are missing True Market Leadership stocks setting up
PRICE ACTION
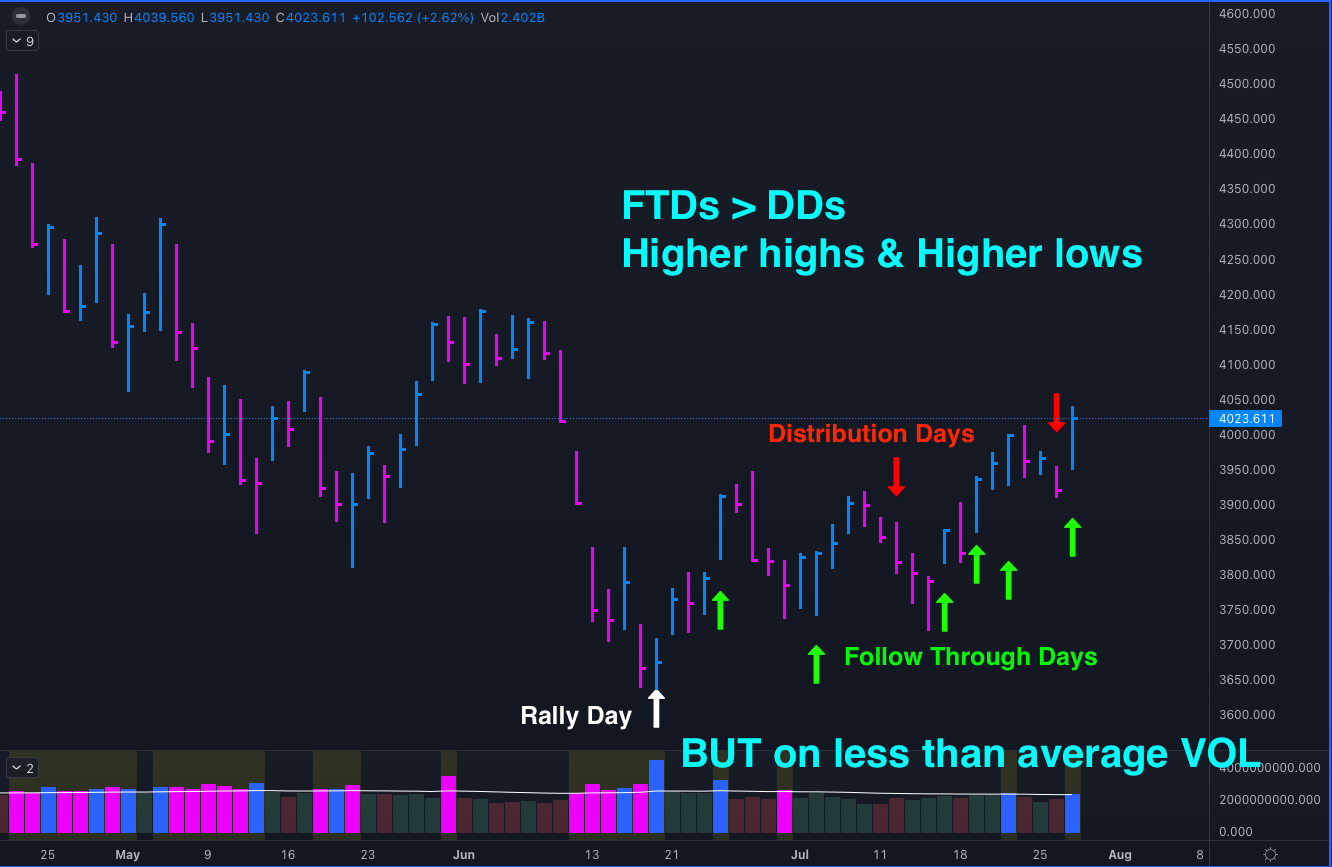
We did get a rally day on 17 June 2022 and subsequent Follow Through Day (FTD)1. If you do not know what a FTD is check out my 9 min explanation - here (for more concept explanations look at the bottom of the letter). After the first FTD we have been printing recent strong up-days marked with a green arrow in Picture 1. What has been good is that unlike the other rallies on the way down, this has not been met with immediate Distribution. However, the problem is that all of this action has been happening on below average volume - we are missing the explosive action up👆!
Picture 1: S&P500 Recent Daily action.
VOLUME ACTION
Unlike the last time when we were getting a 🚀“lift-off” volume signs (above 9 for the Up/Down Volume ratio) which were met with instant 🎱“drag-down” volume, this rally has seen multiple “lift-off” days and no instant reaction. This of course is good as it shows strengthening in the market.
Pro tip: The last excessive down/up volume (pink bar in Picture 2) sometimes marks the bottoming capitulation! What you want afterwards is a strong action subsequent - which is what we are getting.
Picture 2: Up/Down Volume (Blue) & Down/Up Volume (Pink) with recent price action in S&P500.
SENTIMENT
PUT CALL RATIO
Put volume is still relatively high - which is another good sign! It means that people are buying more puts (aka betting that the market will fall) than calls. Of course the Put Call Ratio2 indicator is contrarian - this means that 🐻bearish readings are actually 🐂bullish for the market in the short term.
Picture 3: Nasdaq Put Call Ratio (bottom pane) vs recent price action.
AAII BULLISH VS BEARISH ADVISORS
Looking at the AAII3 - the high negative sentiment suggest that the market has already discounted many upcoming bad news. This is also bullish for price action since it suggests that bad news are expected and priced in already. What does this mean? Well something like this: “We are getting a recession? We were expecting it! We are getting more COVID cases? We were expecting it! International conflics? We know! “and so on…. 🗣
Picture 4: Nasdaq Put Call Ratio (bottom pane) vs recent price action.
MACRO ECONOMY
YIELD CURVE
The 10 year yield curve4 has been coming off quite a bit recently! This is a sign that inflation is peaking and if this is the case this means that may be the market has seen its lows. Inflation has been the main problem and the reason why we are getting Quantitive Tightening and market reaction. Current market action very much follows the logic Inflation–> Fed–>Market. 🏦
Picture 5: 10 year yield curve is peaking.
ECRI WEEKLY INDEX
The ECRI5 Weekly Leading index has been following the market and historically the market has been the best leading indicator for the general economy. However, the ECRI year-year we have come to levels when recessions do happen. So this could be a warning sign here. However, my reading is that the market can out manoeuvre much more downside and work its way up. 🌎
Picture 6: S&P 500 vs ECRI Weekly Index (source Elaine Garzarelli)
FED RAISING RATES
I suspect that the rising rates6 can play like the 1995 scenario. Where the market bottoms prior to the stop of the raising rates. Cycle work suggests October 2022 for this IF it is to happen. Then a pause will allow to continue pushing higher and when finally the declining rates come then the market pushed even higher. 👆
Picture 7: How did raising rates affect the market in 1994 and 1995 (source Elaine Garzarelli)
QUANT POINTS
We are getting a number of studies that show that price action is similar to previous bear markets. For the historians among you, I would encourage you go and study the way we have gone down and the way we have bottomed. In particular:
1962 Bear Market Bottom
1990 Bear Market Bottom
Also we did get a massive -15% decline in a quarter, which when backtested has shown that leads to bounce in the general market (S&P500). This might be the explanation for the recent trading rally.
What we are missing is an abundance of stocks setting up and working from breakouts. I speak about this a lot in our Discord community. Getting this abundance will be a sure sign to put pedal to the metal. If you want to know which stocks we are looking at, buying and how we read the market action pop in to talk to us.


