It’s always the small pieces that make the big picture - quote from Google search
Joke aside - I decided to start off these series (Anatomy of charts) with a template about the price movement that stocks live through.
Table of Contents
Introduction
The Anatomy of Market Cycles
The Template
The Four Stages of Market Cycles
   Stage 1: The Uptrend
   Stage 2: The Sideways Top
   Stage 3: The Downtrend
   Stage 4: The Sideways Bottom
Conclusion👋Introduction
Welcome to the Anatomy series, where we break down important technical setups into simple designs with easy-to-understand explanations. In this post, we'll explore the Anatomy of Market Cycles, a crucial concept for traders and investors alike. By understanding the stages of market cycles, you'll be better equipped to navigate the ups and downs of the stock market.
I have collected many charts like these over the years that have helped me tremendously to up my trading game. Now, I want to share them with you.
Pro Tip: For the overachievers, you can collect these posts and make you own Model Book of the setups. Add annotated examples of charts that you have seen like these.
🩻The Anatomy of Market Cycles
When we talk about charts, we often mention the word fractalss1. This means that charts appear over many timeframes and look exactly the same. However, the higher the timeframe, the lower the noise. That's why I personally concentrate on daily and weekly timeframes for analysis. The chart in the next section shows the big picture of what a stock price usually experiences. This is why, I have personally concentrated on Daily and Weekly timeframes as my go to for analysis.
Example of a fractal - pattern within pattern👆
The Template
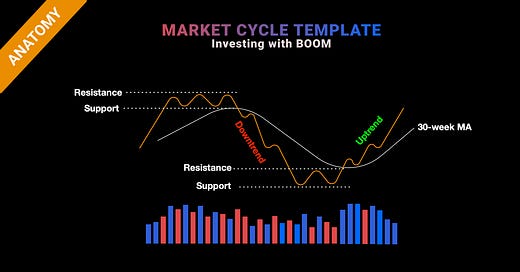
Picture: Market Cycle Template
🟧 Price action ⬜️ 30week MA 🟦 Volume on up days 🟥 Volume on down days
4️⃣The Four Stages of Market Cycles
Market cycles consist of four stages: the uptrend, the sideways top, the downtrend, and the sideways bottom.
Stage 1 The Uptrend☝️:
The initial uptrend happens when the stock is making higher highs and lower lows above the 30 week moving average.
This movement is characterised with high volume on up days.
The beginning of the uptrend is characterised with a clear breakout above a previous trading range that signals that supply < demand.
The moving average (white line above) is pointing upwards ↗️ at this point. During the uptrend there are many consolidation (bases) which I will teach you in the upcoming series.
Stage 2 The Sideways top⛰️:
At some point the price will become rangebound and will oscillate back and forth. Something we traders refer to as “sideways” or “whipsaw” action. In well defined sideways action, it will be easy to define a resistance and support levels where the stock is sold and bought by market participants.
The price action would occur around the 30 week moving average.
The volume would be lower then average with similar patterns between up days and down days.
The 30 week moving average will be pointing sideways →.
This shows that supply = demand.
Stage 3 The Downtrend😰:
As time progresses, the stock breaks the low of this trading range and the Moving average. The stock will start making lower lows and lower highs. This will constitute the downtrend phase of the price action.
The action will occur under the 30 week moving average, which will be point down ↘️ .
The volume on the downdays will be higher than the volume on the up days.
This shows that supply > demand.
Stage 4 The Sideways bottom👉:
When the stock finally bottoms it will start acting very similar to the Sideways top action.
Trading within a range, back and forth - below and above the 30 week moving average.
The 30 week moving average will be pointing sideways →.
This shows that supply = demand.
There is not going to be distinct volume pattern, and likely will be below average.
After Stage 4, Stage 1 occurs and the whole lifecycle repeats.
Example
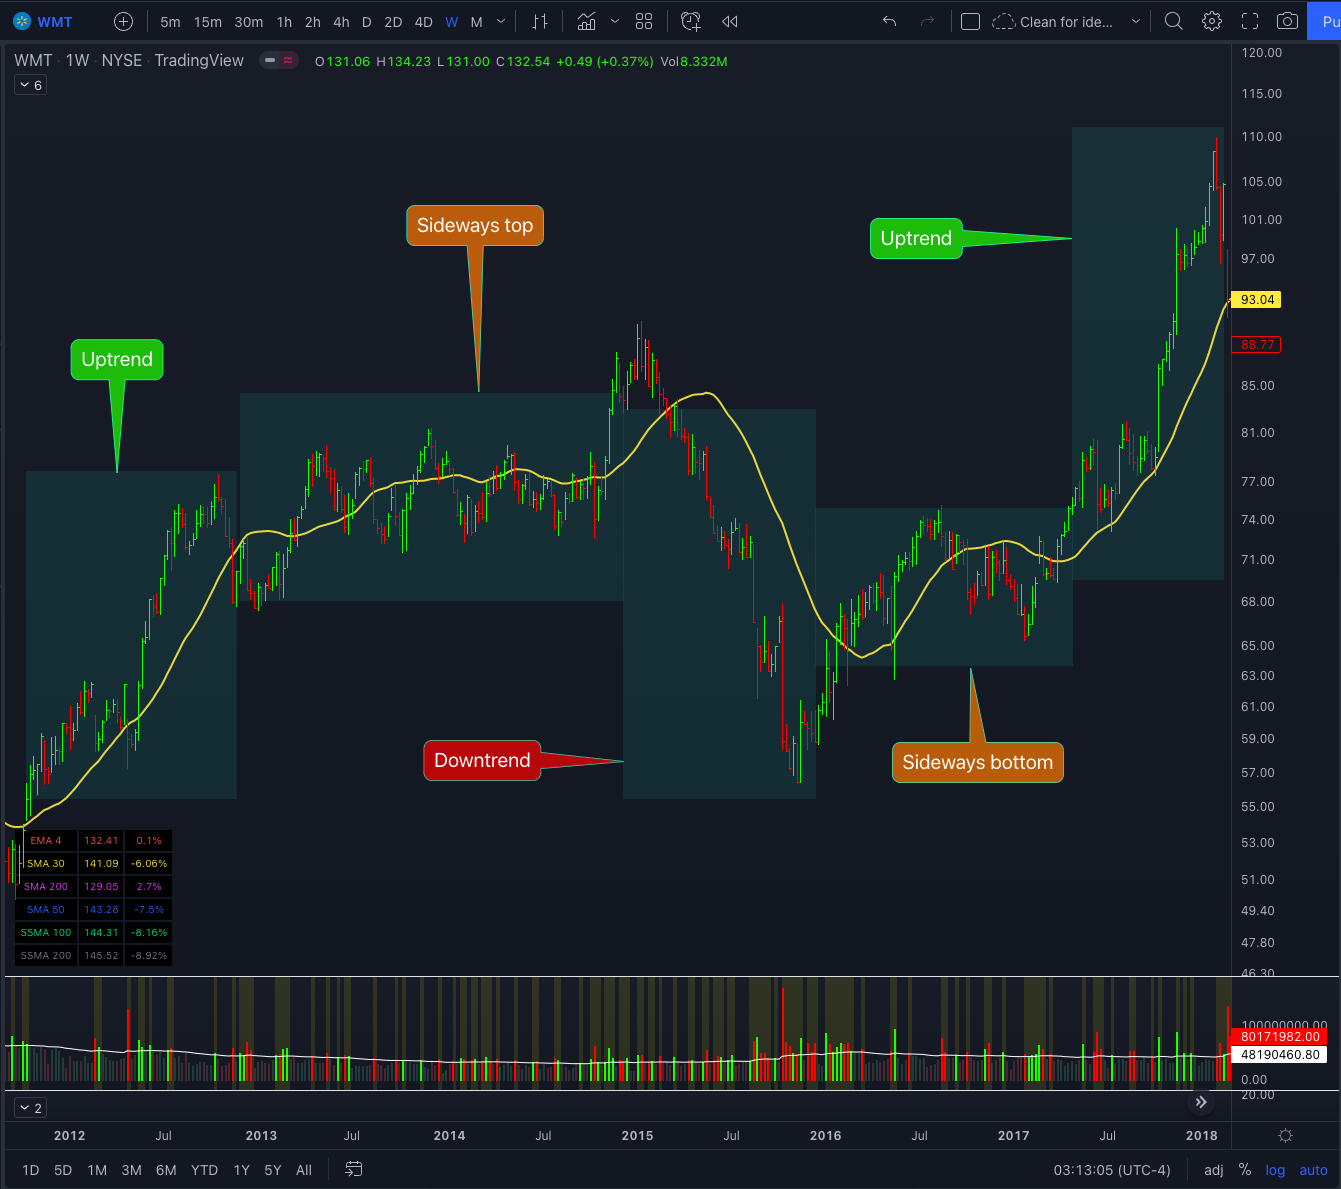
WMT weekly chart between 2012 and 2017
🤷♂️What’s next?
Now that you understand the anatomy of market cycles and the four stages of a stock's price action, you're well on your way to becoming a more successful trader or investor. But there's always more to learn, and that's where our Stage Analysis course comes in.
In this course, we dive deeper into the nuances of stage analysis and teach you how to apply it to your trading strategy. With our expert guidance, you'll be able to identify winning trades and maximize your profits. Sign up for our Stage Analysis course today and take your trading game to the next level!
The Anatomy Series Schedule
Episode 1: Market Cycle
Episode 2: High Tight Flag
Episode 3: Flat base
Episode 4: Cup and Handle
Episode 5: Double Bottom
Episode 6: Saucer Base
Episode 7: 3 Tight Closes
Episode 8: Chart Pattern Cheat Sheet


