Empty your cup, so that it may be filled - Bruce Lee
Table of contents
1. Key Points about Cup and Handle Pattern
2. What is the Cup and Handle Pattern
3. Is the Cup and Handle Pattern Bullish
4. Psychology of the crowd
5. Stages of a Cup and Handle Pattern Formation
6. How do you play a Cup and Handle Pattern
7. Example of Cup and Handle Pattern
8. Fun fact about Cup and Handle
Key Points about Cup and Handle Pattern
The cup resembles a U shape and not a V shape
CHW lasts between 7 weeks to 65 weeks (35 days to 325 days)
Depth of the cup varies from 15% to 35%
During Stage 1 look fro +30% increase from previous base with good relative strength
The High of the handle should be within 15% of the high of the cup
The Depth of the handle should be proportionate to the depth of the cup. General rule of thumb is 1/3 of the Depth of the cup (if the Depth of the cup is 30% then the depth of the handle should be about 10%)
🤷♂️What is the Cup and Handle Pattern?
One of the most important chart patterns in the stock market is the Cup and Handle Pattern, invented by William O’Neill. Sometimes you might see it abbreviated as CWH. It also holds the crowd proclaimed title as one of the most profitable and reliable breakout patterns. The Cup and Handle Pattern forms as a bullish continuation pattern that can be found during strong trend.
🐂Is Cup and Handle Pattern Bullish?
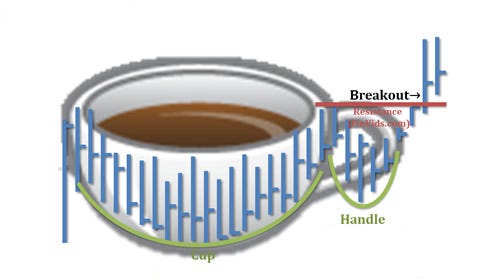
William O'Neil cup and handle patterns represent bullish continuation patterns that mark consolidation periods which are followed by breakouts. This pattern includes two components: cup and handle . After advancing, this cup is formed in a bowl shape or with a rounded bottom. Handle forms in the upper third of the cup.
🧠Psychology of the crowd
Euphoria: As the price rises, the prior advance makes the stock to saturate with weaker shareholders and late comers.
Fear: At some point weaker participants start to book profits forming the high of the cup, which triggers selling. This causes price drops as the cup forms. The distance from the high of the cup to the low of the cup is referred to the depth of the cup.
Hope: After the decline stops, supportive bullish investors will create additional demand and absorbs this newly created supply. This will cause the price to wave to move up.
Denial: As the price reaches the towards the high of the cup, participants who entered at the low of the cup and those who are came late to the party start to book profits, which is again quickly absorbed by the longer term holders.
Excitement: As institutions look to grab hold of the stock and start to aggressively buy it. The imbalance of demand and supply will occur at the breakout point. As the price breakouts on increased volume, the ticker moves from this base formation and forms its bullish continuation pattern.
🔄Stages of a Cup and Handle Pattern Formation
Stage 1 Setup:
The pattern starts when a price raises from a former base, making the prior trend a bullish trend. At some the profit taking starts taking place and the stock begins the decline, forming the high of the cup. The high of the cup is also called the ‘Left Cup’
Stage 2: Decline:
The stock starts to form a new base. It is normal to see above average volume at the beginning of the decline. The volume element is important since it ensures that later buyers to the party are out of the stock and do not provide an overhead supply. By the end of Stage 2 the volume would have fallen below average. This low trading volume is combined with price consolidation around the low of the cup.
Stage 3 Recovery:
The stock starts to recover and the volume on up days starts to pick up. This indicates that institutions are taking interest in the stock. Pro tip: look for low volume on down days. Now we still have a few more types of players into the stock: the bottom fishers who bought in at the low of the cup and the bag holders who have bought at the high of the cup and have been sitting on a loss. As the stock price moves up, these would partially close their positions making the recovery process a stair stepping process rather than a V shaped recovery. As the price reaches close to the High of the cup, the last bag-holders will cut their losses and will create a large volume sell-off. At this point the “Pivot” is formed or the “High of the Handle”.
Stage 4 Consolidation:
After the High of the handle, the price is likely to continue its handle formation. The handle pattern occurs as there are still weak hands in the ticker. A shakeout preferably on higher volume is considered a bullish continuation in the cup and handle pattern formation . This indicates that all overhead supply is depleted. The point when the price starts to climb again and reaches the high of the handle is the breakout point. We will look for a to price breaks on higher volume to indicate that institutions have taken control of the stock and that the sky is clear to move upwards. A rule of thumb is to look for a price target with the same value as the prior advance from previous base as the one subsequent to Stage 1.
🤑How do you play a Cup and Handle Pattern?
As you understand the pattern happens during price decline followed by consolidation stability. The perfect buy point is the breakout point. In the image above it is drawn with a green dot and labeled "Buy Point". The valid buy point requires:
1) Proper formation of the base. This is why you have the anatomy as a cheat sheet, but the main non-negotiable characteristics are: +30% price advance prior to the base, depth no more than -30%, duration of of minimum 7 weeks (35 days) for the cup, handle patterns in the upper third of the cup.
2) Conclusive breakout. This refers to the increased trading volume as the price clears all the supply. If you draw a horizontal line at the breakout you will see that this offen happens when the price moves over the high of the handle. Volume is required to be over 40% of the 50-D Simple Moving Average volume.
3) Maximum stop loss. Stop loss should not be only dependant on technical analysis. Rather it should incorporate your trading style and Year to date trading results (I spoke about this here). However, from a technical analysis standpoint the stop loss should be either on the low of the handle patterns or if the price allows on the just under the cup depth.
Example of Cup and Handle Pattern
📊 Chart Patterns and Performance Statistics
Like most patterns, cups fail because of the inability of the stock to rise by at least 5% before declining.
The target price based on which the success rate is calculated is by determining the height of the formation from lowest low in the cup to the high at the right cup lip and adding the difference to the high at the right cup lip. This target price is generally reached only 50% of the time (and in bear market this recent is 27%) if you however, take half of this target price ten the success rate ramps up from 50% to 76% (and 55% in bear market ).
Summary of Statistics
Success rate: 50% meeting the price target (price target explained below)
Average rise: 34% in a bull market and 23% in a bear market
Throwback rate: 58%
Break-even failure rate: 5%
Fun fact about Cup with Handle
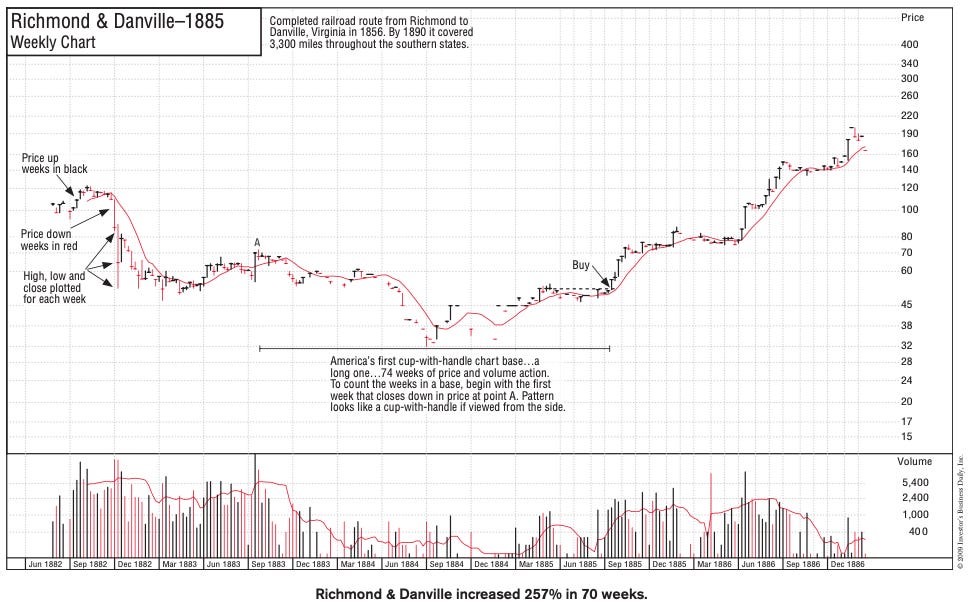
This is America’s First Cup with handle 👇
The name cup and handle is used since the pattern resembles a coffee cup looked from the side.
Thank you!
💡These posts consume most of my Sundays! If you have received value:
Share it on Twitter (using the button below)
Subscribe to the newsletter.
This way You will help grow the community together!
Like the Anatomy Series? Here’s the Schedule 👇
Episode 1: Market Cycle
Episode 2: High Tight Flag
Episode 3: Flat base
Episode 4: Cup and Handle
Episode 5: Double Bottom
Episode 6: Saucer Base
Episode 7: 3 Tight Closes
Episode 8: Chart Pattern Cheat Sheet


