Ultimate Chart Pattern Cheat Sheet - The Good and Bad of a Trading Base
Get your Base Analysis Checklist
📖Table of contents
1. Introduction
2. Part I: The Anatomy of a Proper Base
3. FREE UPDATED IBD CHECKLIST
4. Part II: Warning Signs of a Faulty Base
5. Part III: Contextual Considerations
6. Conclusion
🤓The Anatomy Series Schedule
Episode 1: Market Cycle
Episode 2: High Tight Flag
Episode 3: Flat base
Episode 4: Cup and Handle
Episode 5: Double Bottom
Episode 6: Saucer Base
Episode 7: 3 Tight Closes
Episode 8: Chart pattern Cheat Sheet (current read)
Introduction
Brief Overview of the Importance of Recognising Proper and Faulty Bases in Trading
In the world of trading, the ability to differentiate between proper and faulty bases can significantly impact your investment and financial decisions made. Proper bases serve as launch pads for potential breakouts, while faulty bases often lead to false signals and, consequently, losses. Understanding the subtle nuances between the two can be the difference between riding a bull wave or getting caught in a bear trap. We will utilize technical analysis over past market data to analyse our chart patterns.
Article Mission:
This lesson aims to bring that extra edge for your trading decision! This article aims to serve as your ultimate, chart analysis and patterns cheat sheet for identifying the characteristics that signify a proper or faulty base. By using a checklist of key factors and metrics, traders can elevate their chart pattern analysis to make more informed and effective trading decisions.

🍹Part I: The Anatomy of a Proper Base - quick refresher
What Makes a Base "Proper"?
If you have been reading the other episodes on Chart Anatomy, you know what are the basic requirement for a base. Now in this article we will bring your knowledge to the next level. In the context of trading, a "proper base" serves as a consolidation period with high probability that prepares a stock for its next potential move upwards. There are certain characteristics and metrics that can help traders identify such bases. From the stage of the base to its depth and length, multiple factors contribute to its 'properness.' The following subsections will delve into these criteria, offering traders a comprehensive understanding of what to look for.
🏋🏻♂️Exercise: For beginner traders there is a very effective exercise to keep them away from trouble. This is: if you cannot identify the base and measure it, you do not trade it. So before any purchase, open the weekly chart and say what chart patterns am I seeing?
🧱BASIC CHECK 1: How Much Was the Prior Uptrend?
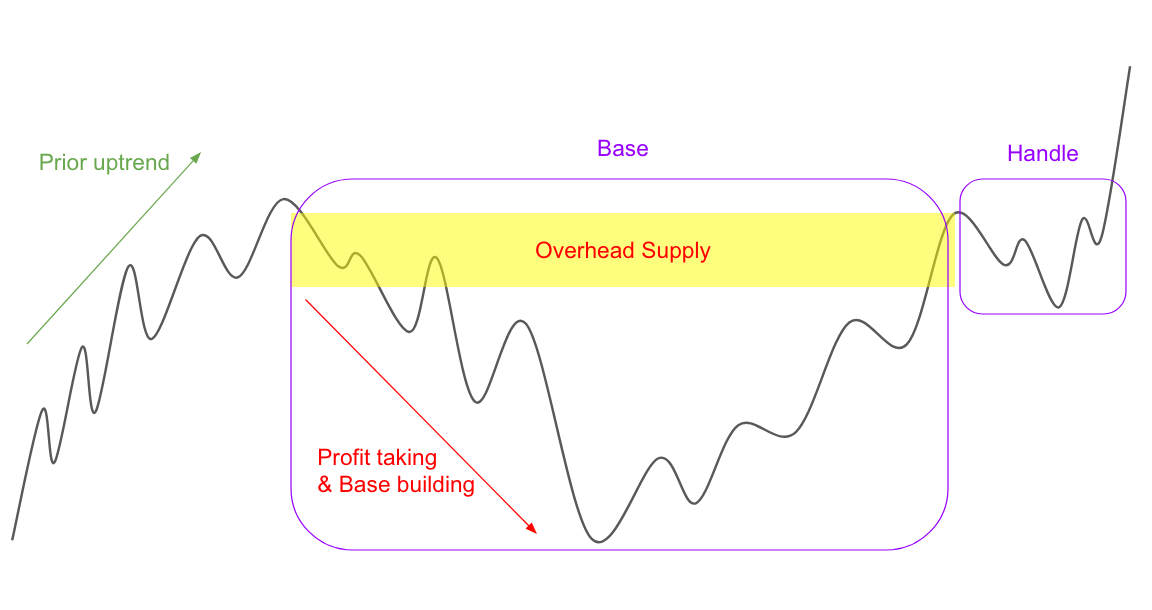
The prior uptrend is a crucial factor in identifying a proper base. Generally, a substantial uptrend of at least 20-25% before the base formation is considered a positive sign. This indicates that the stock has sufficient momentum and investor interest, setting the stage for a potential trend reversal and possible future breakout. The prior uptrend serves as the prelude to the base, and its quality can often foreshadow the potential success of the next trend continuation ensuing pattern.
🧱BASIC CHECK 2: What Stage Base Is It?
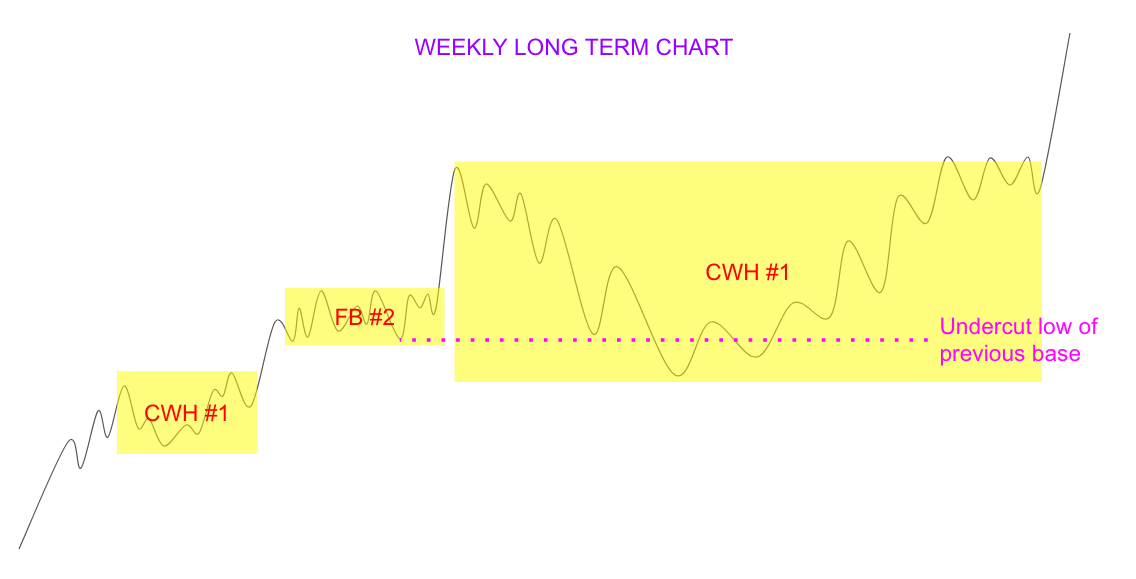
Understanding the stage of the base is vital. Bases are categorised into different stages, commonly labeled as Stage 1, Stage 2, etc. Early-stage bases, particularly Stage 1 and Stage 2, are often considered more reliable for future breakouts. This is because the stock is generally less extended at these stages, reducing the risk of a significant pullback. Late-stage bases, on the other hand (after Stage 4-5), can be riskier as they often come after the stock has already made a substantial move. Notion to the reader: Do not confuse Stage in Bases with Stages in the Stock (the latter referring to the Stage Analysis methodology coined by Stan Weinstein).
🏋🏻♂️Exercise: Stage counting can be confusing to newer traders. Here is a quick and dirty hack to help you count properly. If the low of the current Base undercuts the prior Base, then we reset the count. Remember we use the weekly charts to analyse bases! Look at the example below
🎁 FREE UPDATED IBD CHECKLIST + DISCOUNT COUPON
Excel Checklist: Here you can grab the chart pattern cheat sheet that will help you determine the lessons and rules shared with you in the newsletter. If you want to grab the Excel Checklist please Like this Article and comment "Checklist, please" and we will email it to you.
🎁 INDICATOR DISCOUNT: Alternatively, if you want to really step up your trading game, I have implemented most important of these teaching in my Premium Indicator [TTI] IBD Base Analysis weekly. For the subscribers of the newsletter and readers of this article you can get 15% DISCOUNT using the coupon: BASENEWS
Base Characteristics
In addition to prior trends and stages, several other characteristics play a key role in defining a base as "proper." These characteristics include the depth and length of the base, its location within the overall pattern, and specific volume indicators. Let's explore these features in detail. The whole anatomy series is about these Base Characteristic features.
✅Depth and Length: Why Keeping These Within Normal Ranges Matters
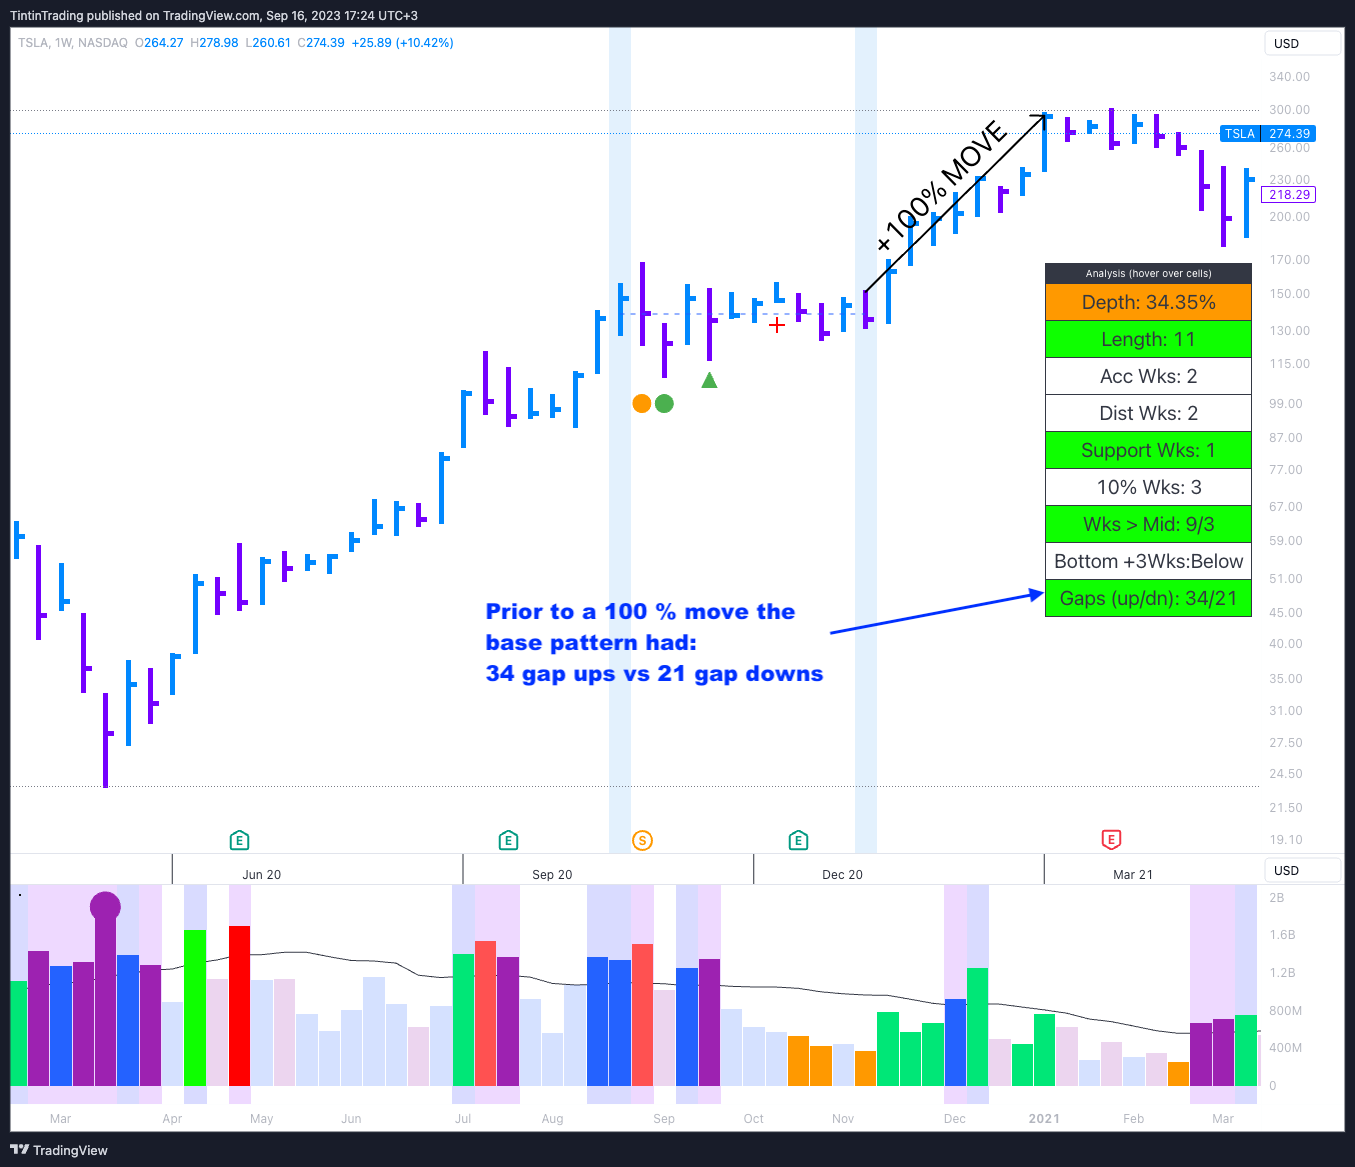
The depth and length of a base can significantly influence its reliability. Ideally, a proper base should not correct more than 30-35% from its peak. Length-wise, a base that forms over a period of 7-8 weeks is usually more reliable than one that forms too quickly. A too-deep or too-short base can signify volatility and uncertainty, reducing its reliability as a launch pad for a future uptrend. For more information look back into the other series. But as a general rule of thumb, we want to see well formed symmetrical base. The [TTI] IBD Base Analysis indicator grabs those numbers for you and shows you the statistics that you have to pay attention to. When the statistics are lime green, you can conclude that general structural chart patterns are being met.
🚩Base Location: Why Too Much of the Base in the Lower Half of the Pattern Is a Red Flag
The location of the base within the overall chart pattern is another important consideration. If the majority of the base is located in the lower half of the pattern, it often suggests weakness and reduces the likelihood of a successful breakout. Such a pattern occurs when a base may lack the support levels needed to sustain an upward move, making it a less ideal choice for traders. Apart from the majority of the base action, you want to consider the position of the handle. If you have learned the basic structures of chart patterns, then you would know that if a handle happens too low in the base it is a lower probability setup (that being said there are some advanced buying techniques coined by Market Wizards like Mark Minervini, called Cheats and Low Cheats, which are buy point in the lower and mid third of the right hand side of the consolidation chart patterns).
🏋🏻♂️Exercise: Take the high of the base and the low of the base to determine the mid-way point. To automate this the indciator draws in dashed blue the mid-point of the base for you. The [TTI] IBD Base Analysis indicator will plot that automatically for you.
✅Volume Indicators: The Role of Volume Drying Up in the Handle or at Base Lows
Volume indicators provide crucial insights into investor sentiment. In a proper base, volume should generally dry up in the handle or at the base lows. This reduction in volume is a sign that selling pressure is decreasing, and it often precedes a volume surge on the breakout. It serves as a confirmation that the stock is likely consolidating before a potential upward move. On many of our charts you will see an orange Volume bar. This is a Volume Dry up signal.
🚨Vital Metrics
The health of a base is often reflected in its weekly price and volume behavior. Paying close attention to ‘Blue Weeks,’ ‘Red Weeks,’ and ‘Supporting Weeks’ can provide valuable insights into the stock’s potential for a breakout or breakdown. These metrics serve as the pulse of the base, offering traders a more nuanced understanding of its quality. This is one of the first things that the legendary Market Wizard William O'Neil did when analysing chart patterns.
✅ Blue Weeks: Up on Above-Average Volume
In a proper base, ‘Blue Weeks’—weeks where the stock closes up on above-average volume—are a bullish indicator. We call these weeks also Accumulation weeks. They demonstrate strong investor interest and buying activity, often signifying that institutional investors are accumulating shares. A higher number of Blue Weeks in a base is generally an encouraging sign and suggests that the stock has the momentum needed for a successful breakout.
🚩 Red Weeks: Down on Above-Average Volume
Contrastingly, ‘Red Weeks’—weeks where the stock closes down on above-average volume—are a bearish sign. These indicate increased selling pressure, often from institutional investors offloading shares. While a few Red Weeks are normal in any base, an excess can be a red flag that signals a potentially faulty base.
✅ Supporting Weeks: Down on Above-Average Volume with a Closing Range of +40%
‘Supporting Weeks’ are somewhat of a middle ground. These are weeks where the stock is down on above-average volume but closes in the upper 40% of the week’s trading range. Such behavior often indicates that the stock found support during the week, which can be a bullish sign. It shows that despite the increased volume, selling pressure was unable to push the stock significantly lower. The 40% Closing range mark is a rule identified by William O'Neil, founder of Inverstor Businness Daily, after conducting a multi decade long study.
These 3 conditions are the first thing you have to look at every base. My custom trading indicator called [TTI] IBD Base Analysis, does this automatically.
Advanced Factors
While prior trends, base characteristics, and vital metrics provide a broad framework for evaluating a base, traders should also consider several key factors that often serve as tipping points. These include volume support areas, gap-ups, and the overall structure of the base. Let's delve into these elements.
✅ Volume Support Areas: Importance of Big Volume Key Support Areas
This is the skill reading volume. New traders often get confused how to correctly read volume and often a small decline on massive volume would puzzle them. Volume support areas are specific price ranges where a stock receives substantial buying interest, often from institutional investors. These areas are crucial because they act as a safety net, providing a level at which the stock is less likely to fall below. The presence of big volume key support areas within a base adds an extra layer of reliability and increases the odds of a successful breakout. The supporting areas that we look to have big volume are the bottom of the base, so how does it act when it turns from the bottom and then how does it act in the second half of the base this means after it has turned up. We want to see bigger volume on up weeks in the second half of the base and big volume around the bottom of the handle prior to a breakout volume on the breakout of the pivot.
🏋🏻♂️Hack: Here is an indicator for you to help you navigate volume reading: FREE INDICATOR HERE
✅ Gap-Ups: Their Significance in the Base
Gap-ups, or abrupt upward price jumps between trading days, can signal strong investor enthusiasm. While a single gap-up is not enough to validate a base, a pattern appears multiple gap-ups within a base can be a bullish indicator. They suggest a sense of urgency among buyers and can often precede a substantial upward move. The place for gap ups again is when the stock turns up. One of the rules you want to develop is to have the number of daily gap ups be more than the daily gap downs. In my custom indicator, this is automatically counted. When the condition is satisfied the indicator turns lime green.
✅ Structure: Tightness and Symmetry in the Base Structure
A tight and symmetrical base structure is usually a positive sign. It indicates that the stock is trading in a controlled manner, without excessive volatility. Such a structure makes it easier to identify support and resistance levels and to anticipate potential breakouts or breakdowns. A base with a tight, symmetrical structure is generally more reliable than one that appears loose and disorderly. While it is expected that during market corrections growth stocks to correct about 2-3x more, tight bases provide a very bullish signal. Using our indicator we check the base for tightness by 2 parameters.
1) ✅ How is tight is the weekly action. In our indicator this is shows with a small red cross under the week. This is favorable, especially when it occurs around the bottom of the base. Read in more detail in section Tight Weeks below.
2)🚩 We count how many weeks move with more than 10% weekly change. This is unfavorable metric and we want this number to be as little as possible.
Additional Considerations
While the aforementioned criteria are essential in evaluating a proper base, there are additional nuances that can provide further insights. These include the presence of tight weeks within the base, any shakeouts that occur, and signs of distribution on the left side of the base. Each of these factors contributes to the overall picture and can offer a more nuanced understanding of a base's quality.
✅ Tight Weeks: The Importance of Having Tight Weeks in the Base
Tight weeks within a base are weeks where the stock trades within a narrow price range, often on below-average volume. These weeks are generally seen as a positive indicator because they signify reduced volatility and selling pressure. No volume = no-one wants to sell, holders want to hold, which is the characteristic of institutional funds. A base with several tight weeks is often more stable and offers a stronger foundation for a potential breakout.
✅ Shakeout: Role of a Shakeout Within the Base
A shakeout refers to a sudden, sharp decline in the stock's price that quickly reverses. While shakeouts can be unnerving, they often serve to eliminate weak holders, setting the stage for a more sustainable move upwards. A shakeout within a base can be a positive sign if it's followed by a strong recovery (remember the +40% Close range on the weekly candle?), as this often bullish reversal can indicate that the stock is shaking off sell-side pressure. Sometimes a shakeout around the bottom can be very positive sign, when followed by imminent up weeks and good close range.
🚩 Distribution: Signs of Too Much Distribution on the Right Side of the Base
Too much distribution, particularly on the right side of the base, can be a warning sign. This means that the stock has experienced significant selling, often by institutional investors, in the base formation. Excessive distribution can undermine the base's integrity and decrease the likelihood of a successful breakout, making it a crucial factor to monitor. We expect to have distribution weeks on the left hand side of the chart patterns but on the right hand side could indicate weak hands buying. As shown in the example below right hand distribution weeks is not favorable.
🚩Part II: Warning Signs of a Faulty Base
A faulty base can be deceptive, often mimicking the appearance of a proper base but lacking its underlying strength. Identifying these warning signs can be just as crucial as recognising the elements of a proper base. Faulty bases often exhibit certain traits that should raise alarms. These include cups with concave bottoms, cups with straight sides, and late-stage bases, among others. Understanding these characteristics can save traders from falling into traps.
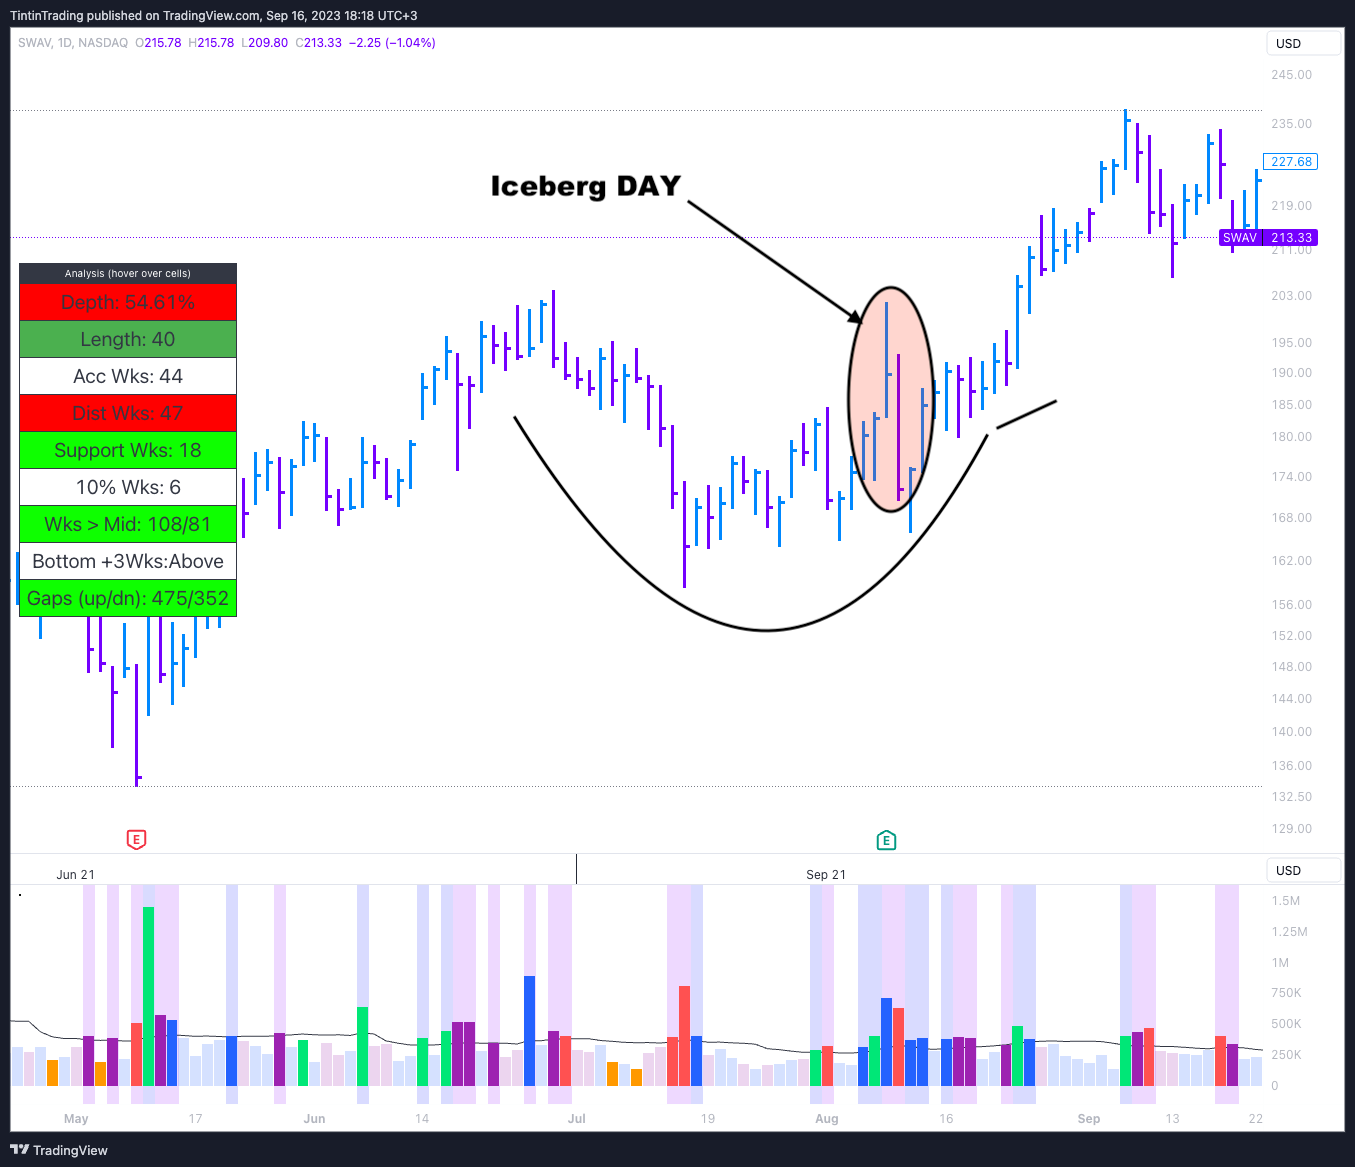
🚩Cups with Concave Bottoms: Why These Are Called "Icebergs" and Why They Are a Red Flag
Cups with concave bottoms, often termed "icebergs," are a sign of instability. Unlike proper bases that have a smooth, rounded bottom, icebergs show a hump in the middle, suggesting volatility in price movement and a lack of steady support levels. Such a pattern can quickly break down, leading to price movements and potential losses.
🚩Square Cups: non rounded cups are meh
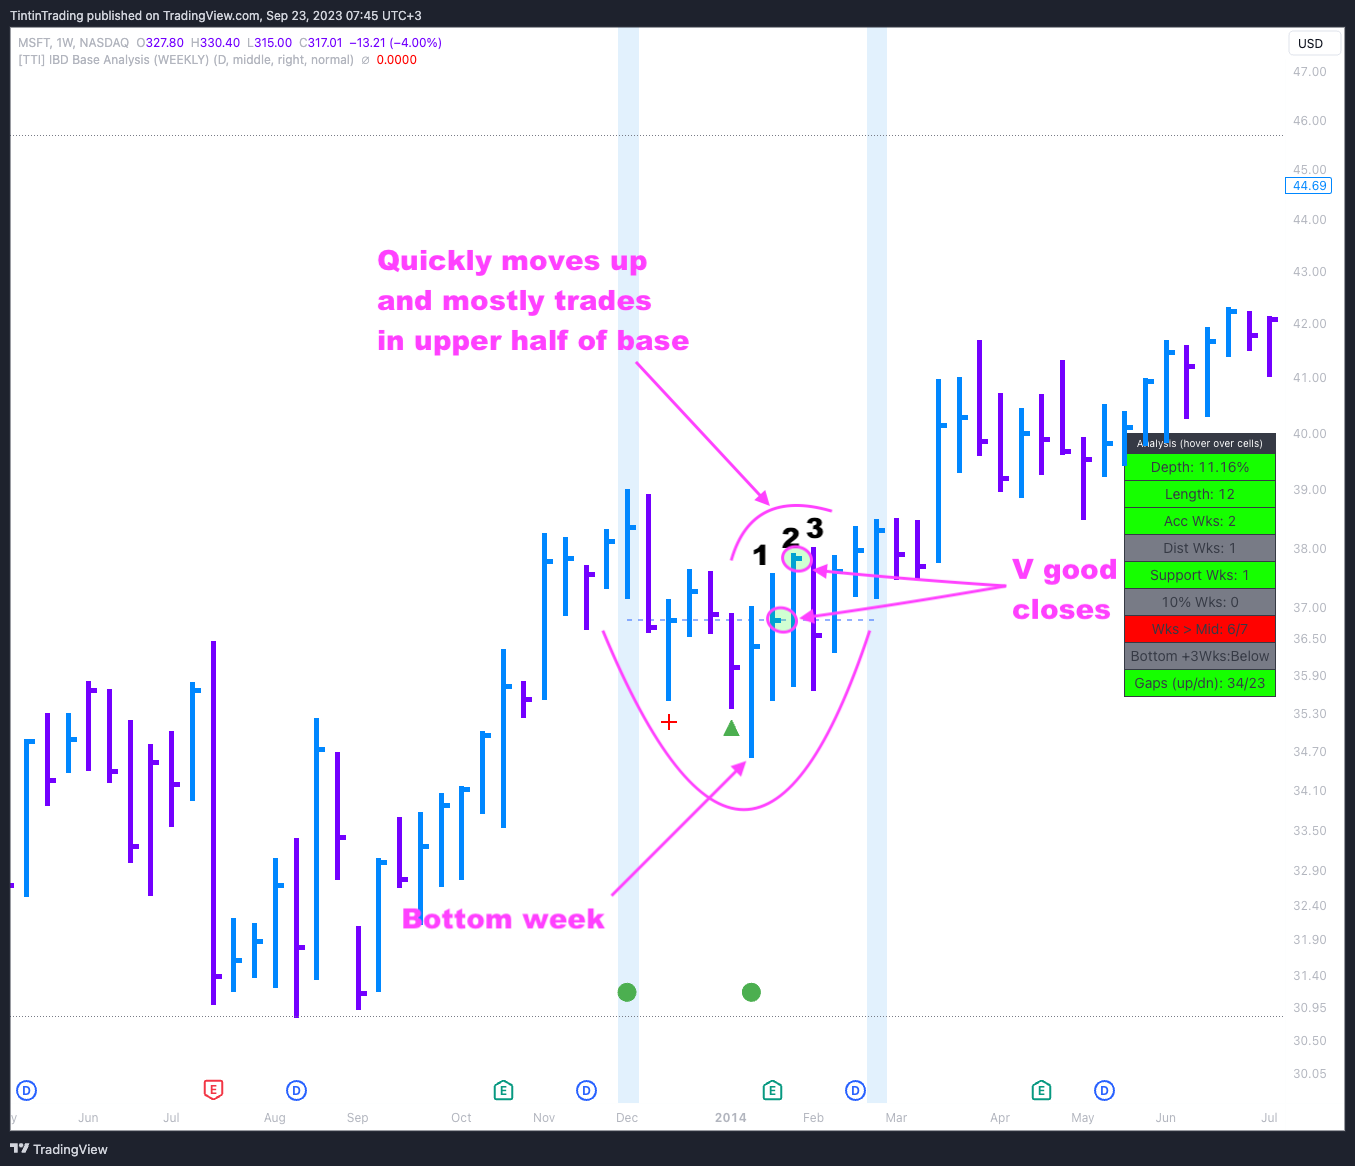
Cups with straight sides and flat bottoms are also a warning sign. Unlike the ideal rounded bottom, straight sides indicate a lack of buying momentum, making the base less reliable for a breakout. These patterns often lead to false breakouts and should be approached with caution. If there is a 90 degree square formation in the cup on the right the annotation that you would often see on the charts is SUFB, which stands for straight up from Bottom (more on this in the next paragraph). The problem when the stock rises very quick on the right hand side of the base is that there is no pauses to consolidate gains and there are no shakeouts of the weak holders. Lack of symmetry is often a sign of major violation. Therefore, beware of square bases with 90 degree edges.
🚩Straight Up from Bottom (SUFB): Why This is Problematic
As mentioned in the previous paragraph base where the stock goes "Straight Up from Bottom" to new highs without any significant consolidation is problematic. It often signals that the stock is overextended and at risk of a pullback. Such behaviour lacks the healthy consolidation that provides a foundation for sustained upward momentum, making it a red flag for traders.
🚩Late-Stage Bases: Risks Associated with Them
Late-stage bases come after a stock has already made a significant upward move and are generally less reliable. They pose a higher risk of failure because the stock is more extended, increasing the likelihood of a substantial pullback. While they can occasionally lead to successful breakouts, the risks are often higher, making them less ideal for conservative traders. A late stage base is considered Base 4 and later.
🚩Lack of Blue Weeks: The Absence of Big Blue Volume Weeks
The absence of Blue Weeks, or weeks where the stock closes up on above-average volume, is another warning sign. Unlike proper bases, which often have multiple Blue Weeks signalling strong buying interest, faulty bases lack this bullish indicator. The absence suggests a lack of investor confidence and can make the base less reliable for future upward moves.
✅ Three most important Weeks: Largest spread, Largest volume and Week on Bottom
While it is important to make a week by week base analysis, sometimes we want to quickly identify if there are any major violations that will deter us from the base. This is when we use the 3 most importnat weeks within the base. These are the weeks with:
Largest Spread (Trading Range)
Largest Volume
The Week making the low in the base
The [TTI] IBD Base Analysis Indicator, plots 3 small dots under where these weeks occur in the base. If the dots are green then the action is confirming, if the dots are orange then the action is not so good. What we want to see is how does the week close within its trading range while these weeks occur. If it closes above the 40% mark then we conclude bullish singal, if not we are considering it as a bearish signal. When you hoover the mouse above the dot you get a pop-up that shows which week this is and what is the Closing range % for it.

✅ Three weeks off the bottom
The other advance tactic is to read what happens the first 3 weeks after the bottom week has occurred. Generally a bullish action here is when after the stock prints its week on the bottom we see 3 subsequent strong weeks that take the stock into and above the mid level point. Again, there is some art to it, you do not want to see straight up action, that is too fast. We want symetrical cup with obvious accumulation on the right side.
🚩Relative Strength Concerns
The concept of Relative Strength (RS) is also a crucial metric for evaluating a base. In a faulty base, certain RS-related signs can serve as red flags. These include a declining RS line and a low RS number. Being aware of these signs can help traders avoid pitfalls. If you are using Trading View charts, I have recently created the Minervini Relative Performance Rating (RPR), which simulates the Marketsmith RS rating with great accuracy. More information on [TTI] Minervini RPR here:
✅Relative Strength Line: Little kinks pointing at 1:00 o'clock.
In a proper base, the Relative Strength line, which compares the stock's performance to a benchmark index, often trends upward or remains stable. A declining RS line in a base is a bearish indicator, suggesting that the stock is underperforming the broader market. This trendline decline can indicate weakening investor interest and should be considered a red flag. I would look for a RS line to be point up around 1:00 or 2:00 o'clock and would like to see as little kinks in it as possible. Another addition to analyse your bases is to look when the RS line reaches new highs, especially when it does so before the Price reaches new highs. My Minervini RPR line, shows when the RS line reaches New highs before price.
🚩Low RS Number: Risks Associated with an RS Number Less Than 85
An RS number less than 85 is another warning sign. The RS number quantifies a stock's performance over a specific period, usually 12 months, relative to all other stocks. A low number suggests that the stock has been a weak performer and may continue to lag. While not a deal-breaker on its own, a low RS number in conjunction with other negative signs should make traders cautious. I also look at how many of the last 30 days has the RS line been increasing. For instance, in the example above 18 out of last 30 days the RS line has been increasing, this is another bullish sign as it shows good positive momentum.
Part III: Contextual Considerations
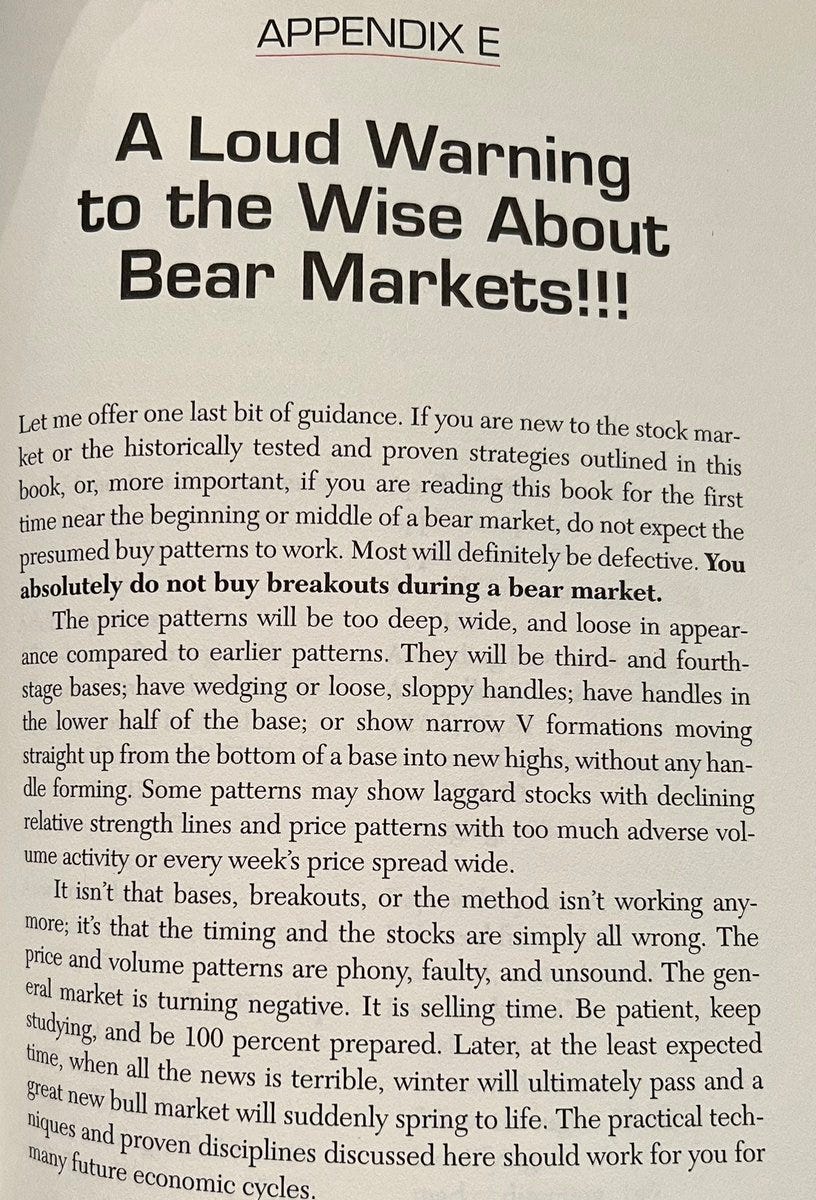
While understanding the attributes of a base is crucial, no analysis is complete without considering the broader market context and the stock's fundamental metrics. Even the most promising base can falter in an unfavorable market, and strong fundamentals can provide added confirmation for a potential breakout. Let's explore these contextual considerations in detail. If you have read HTMMIS (How to make money in stocks) - there is a great section in the book called "A Loud Warning to the Wise about Bear Markets". If you have not read it - it is here below
General Market
Being in sync with the market's overall direction is essential for any trading strategy. Bases do not exist in isolation, and trading patterns and the state of the market can significantly influence their success.
Current Market Trend: Importance of Trading in Line with the Overall Market
Trading in line with the overall market trend can dramatically increase the odds of a successful trade. A strong base in an uptrending market often has a higher likelihood of a breakout. Conversely, even a strong base can struggle in a downtrending market. Therefore, being aware of the market's general direction is essential for contextualising any base. One way that I keep aligned with the trend is using
the [TTI] IBD Market School indicator.
Distribution Days: NASDAQ, SP500, and Dow Jones Considerations
Monitoring distribution days across major indices like the NASDAQ, SP500, and Dow Jones can provide valuable insights. A rising number of distribution days can signal a weakening market and reduce the odds of a successful breakout, irrespective of how strong a base may appear. Thus, keeping an eye on distribution days is vital for a more comprehensive analysis of financial markets. I have automated the whole distribution, stall day, follow through day and various other important counting on the indexes with an indicator called [TTI] IBD Market School, based on the popular course from IBD. More about it here:
Fundamentals - a basic overview
In addition to technical analysis, a comprehensive evaluation of a base should also include an examination of the stock's fundamental metrics. Even though, fundamentals are not the topic of this letter, I will give a general overview to freshen things up. Generally I use the MarketSmith platform, as I find their Ratings very handy, so will refer to those. Fundamentals can provide a deeper layer of insight and offer additional confirmation or warning signs. Key metrics include earnings per share (EPS) ratings, quarterly growth, and estimates, among others.
EPS Rating: Why It Should Be Above 80
An EPS rating above 80 is generally considered a positive indicator. This rating measures a company's earnings growth relative to other publicly traded companies. A high EPS rating can signify strong profitability and add a layer of confidence to a base's potential for a breakout. It's a metric that should not be overlooked when evaluating a base.
Quarterly Growth: Importance of EPS and Sales Growth
Quarterly growth in both EPS and sales is another important factor. Growth rates above 25% for both metrics are considered strong and can indicate the company is in a favorable financial position. A strong quarterly performance adds credibility to a base and can make it more resilient against market volatility.
Estimates and Acceleration: Why These Need to Be Positive
Positive EPS estimates and sales acceleration can provide forward-looking confirmation of a stock's strength. If analysts are revising their estimates upwards and the company shows accelerating growth, it can serve as a bullish sign. These fundamental and other technical indicators can add an extra layer of assurance when considering a base for trading.
Sponsorship
Institutional sponsorship can be a powerful indicator of a base's potential for success. Large trading volumes from institutional sponsors such as mutual funds and hedge funds can provide the necessary momentum for a breakout. Understanding the role of sponsorship can offer traders an extra edge while reading chart patterns.
Volume Considerations: Why More Than 400,000 Shares/Day is Significant
A trading volume of more than 400,000 shares per day is generally considered an indicator of strong institutional interest. Higher volumes can add validity to a base and provide the liquidity needed for a successful breakout. Volume considerations should be part of any comprehensive analysis of a base.
Quality of Sponsors: The Importance of Having Top-Quality Sponsors
The quality of sponsors can also make a significant difference. Top-quality sponsors like well-known mutual funds or hedge funds can add credibility to a base. Their involvement often indicates a strong belief in the stock's potential and can serve as a bullish indicator. Therefore, checking for quality sponsorship is a prudent step in base evaluation.
🎁 FREE UPDATED IBD CHECKLIST + DISCOUNT COUPON
Excel Checklist: Here you can grab the chart pattern cheat sheet that will help you determine the lessons and rules shared with you in the newsletter. If you want to grab the Excel Checklist please Like this Article and comment "Checklist, please" and we will email it to you.
🎁 INDICATOR DISCOUNT: Alternatively, if you want to really step up your trading game, I have implemented most important of these teaching in my Premium Indicator [TTI] IBD Base Analysis weekly. For the subscribers of the newsletter and readers of this article you can get 15% DISCOUNT using the coupon: BASENEWS
Conclusion
In the dynamic world of trading, the ability to distinguish between a proper and a faulty base is invaluable. Armed with a comprehensive checklist and an understanding of key metrics, traders can significantly enhance their decision-making process regarding trading opportunities. From prior uptrends and base characteristics to vital metrics and contextual considerations, each factor offers a piece of the puzzle.
The Ultimate Checklist: Your Go-To Resource
This article serves as your ultimate chart pattern cheat sheet, offering a comprehensive checklist for evaluating bases. This checklist includes considerations ranging from the stage and depth of the base to market trends and fundamental metrics. Keep this guide at hand, and you'll be better equipped to navigate the complexities of chart pattern analysis.









Checklist, please and thank you for your excellent guide
Checklist, please